SSE/AVX alternative to lrintf and other things like that? Or use a third party library others have well optimized?
By looking at this code:
https://github.com/DaemonEngine/Daemon/blob/95915040470b774c818b90caec609b7b3dacfa6f/src/engine/renderer/tr_vbo.cpp#L307-L312
https://github.com/DaemonEngine/Daemon/blob/95915040470b774c818b90caec609b7b3dacfa6f/src/engine/renderer/tr_vbo.cpp#L369-L377
I thought that this was probably the best way to make a compact C/C++ code to save space in a release tarball, but that may prevent compilers to optimize.
So I attempted to write some alternate code on godbolt to see if some other writing can produce SSE code.
I noticed that anytime I introduce a lrintf call the code becomes un-parallelised by the compilers, lrintf having to be called on every component of the vector/array sequentially.
I just replaced the lrintf by a simple truncation just to show the potential of not having a sequential lrintf operation in the code, I know it's does not provide the same result. I don't know how to do a SSE or AVX alternative to lrintf but that gives a good idea about how would be the code if we can do a SSE or AVX lrintf-like call.
We have some other lrintf calls in the code, mostly done by our reusable functions from tr_local.h:
https://github.com/DaemonEngine/Daemon/blob/95915040470b774c818b90caec609b7b3dacfa6f/src/engine/renderer/tr_local.h#L53-L57
https://github.com/DaemonEngine/Daemon/blob/95915040470b774c818b90caec609b7b3dacfa6f/src/engine/renderer/tr_local.h#L85-L91
As we see, anytime we have to do “round and cast to long integer” on all components of a vector, we process them sequentially, while sometime the whole code surrounding can be done on all components at the same time.
On the other hand, maybe we could also look for using a generic vector library others may already have deeply optimized for us, like GLM (MIT licensed). I would be surprised if they would have not already addressed those issues.
The weights as stored in the IQM are 0-255, so maybe those could be stored directly instead of converting back and forth between float/int several times.
Outside of that lrintf code, we may benefit from a third party others maintain and optimize for architecture we use or even don't use yet:
For example GLM has a lot of arch-specific optimizations: https://github.com/g-truc/glm/blob/master/glm/detail/type_vec4_simd.inl
Also it looks like some of our CPU code may be slow.
Here I did some work to optimize non-hardware accelerated model code path: https://github.com/DaemonEngine/Daemon/pull/389
But the hardware accelerated model code path still rely on some CPU code and we can't get rid of it (we still need CPU code to set-up and feed the accelerated GPU code with data).
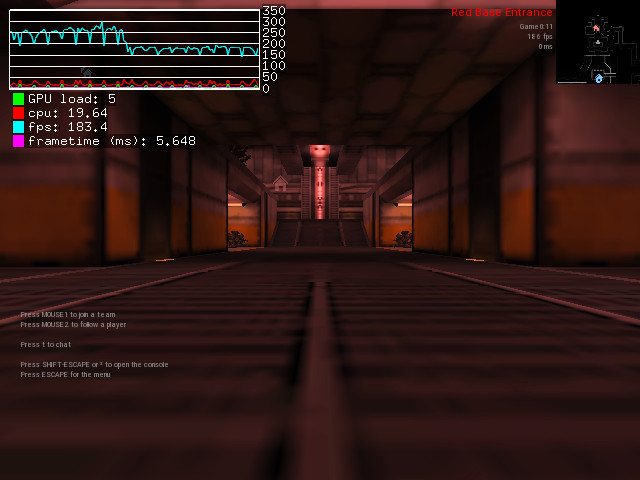
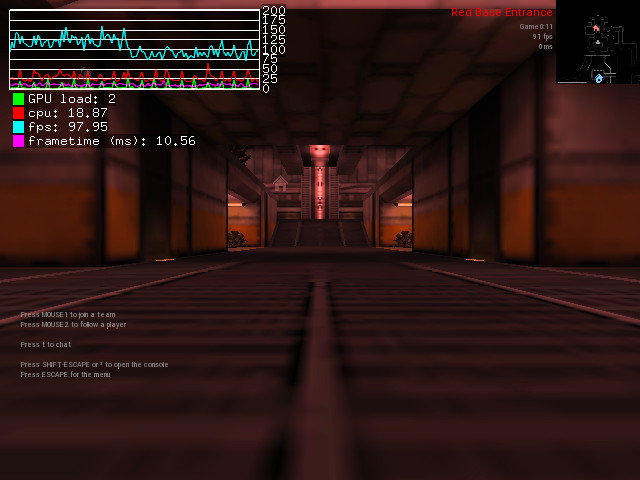
Just for the experience, I compared on my computer the framerate of two scenes while using the “lowest” preset. First scene is the default spectator scene on plat23 map, second scene is a point of view that triggers rendering of all alien buildables in default alien base layout in plat23 map.
The command used is:
( export GALLIUM_HUD_PERIOD=0.07 ;
export GALLIUM_HUD=".x10.y10.w250.h80.dGPU-load+cpu+fps+frametime;" ;
./daemon -set r_fullscreen 0 -set r_noBorder 1 \
-set r_mode -1 -set r_customWidth 640 -set r_customHeight 480 \
+preset presets/graphics/lowest.cfg \
+devmap plat23 \
+set screenscript "delay 5000 screenshotJPEG ; delay 5100 setviewpos 1893 1920 0 0 0 ; delay 10000 screenshotJPEG ; delay 10100 quit" \
+delay 100f vstr screenscript )
After 100 frames rendered, a script is started, waiting for 5s before capturing a screenshot on first scene, then move camera to the second scene and wait for 5s more before capturing another screenshot.
I know the game performance on my CPU (AMD FX-9590) is very sensible to CPU performance profile. Basically, when using ondemand CPU profile instead of performance, it's like if I was using a slower CPU…
So, with performance CPU profile, I get ~260 fps on first scene and ~180 fps on second scene, which is a 30% performance drop.

With ondemand CPU profile, I get ~130 fps on first scene and ~90 fps on second scene, which is a 30% performance drop.

Outside of models, both scenes do not look that complicated, big differences between the two being the presence of animated models.
So, even when using GPU-accelerated model animation code, the cost of models being on screen is huge. Of course a significant amount of fps drop probably comes from the animated GPU code itself, but I would not be surprised at all if a big part of that fps drop comes from the CPU code itself.
What slow CPU code are you talking about? The stuff in the OP only runs at load time.
Maybe I make wrong assumptions but I assume at some point we would still have to tell what model to render, what animation to play and which step in that animation, where is the model in space, and I assume that for some of those computes, we still do vector operations. Though maybe those operations are done in game code and we can't rely on SSE or things like that, I don't know…
One thing I find interesting in my experiment is that the GPU is the same and it uses the same GPU performance profile in both cases. Also all parts and config of the complete computer is the same except the CPU performance profile. And the framerate drop seems to be really tied to the CPU performance, if that framerate drop was mostly because of the GPU having more work to do with those models, I would expect a ratio being different because that GPU performance is expected to be the same in both tests.
I have no real idea about what is giving that 30% perf drop, but it looks like we have CPU being a strong perf limiter. Well, the simple fact I can double the performance by switching my CPU profile from ondemand to performance says a lot.
One interesting thing is that Michael Larabel featured Unvanquished in a recent Benchmark:
https://www.phoronix.com/scan.php?page=article&item=nouveau-kepler-2021&num=3
He tested two GPUs, Nvidia GTX 680 and GTX 760. My own GPU the AMD R9 390X should obliterate them because it's expected to be twice more powerful than those Nvidia GPUs:
https://www.videocardbenchmark.net/compare/Radeon-R9-390X-vs-GeForce-GTX-680-vs-GeForce-GTX-760/3467vs41vs2561
But Michael gets results between 180 and 500 fps given the card, the resolution and the preset.
For example with the GTX 760 he get 502 fps on 1080p resolution and medium preset.
On my end, I get 150 fps on 1080p resolution and medium preset. Well in fact I get a stable 150 fps whatever the combination:
https://github.com/Unvanquished/Unvanquished/issues/1440#issuecomment-867135903
We even see on my screenshots above with 640×480 resolution and lowest preset that if I get an average framerate a bit higher than 150 fps (not that much, and still very far from 500 fps), it's not a real game with many players on screens running around firing weapons…
The big difference I see is that I have an old FX 9590 CPU with DDR3 RAM while he uses a shiny Ryzen 9 5900X CPU with DDR4 RAM.
The CPU seems to be the biggest bottleneck in our game.
The CPU seems to be the biggest bottleneck in our game.
This is matching my experience on my previous laptop with Intel CPU + Intel graphics. According to the Intel vTune thingy, the GPU never reached peak usage. On the other hand, the CPU did in some heavy cases like the plat23 alien base where the FPS count dropped.
Note there was CPU frequency scaling and FPS was caped to 60, so it is to be taken with a grain of salt.
In non-VBO IQM code I'm trying to optimize in #389, I just noticed many of the vector functions are not inline ones, they come from q_math.cpp and what they do is not known by the compiler at the time the tr_surface.cpp file is compiled, the function calls are solved at build time.
If I'm right, it means that if tr_surface.cpp code does something like:
function1( vec );
function2( vec );
function3( vec );
function4( vec );
even if the compiler can turn each function body into SSE code, the computed data has to be brought back from xmm registers to regular registers and do a function call, then store data in xmm registers again, etc. Instead of just storing data in xmm registers at first and then doing SSE functions on them all the way down.
When working on #505 (qcommon: create q_math.h and transform most functions as inline ones), I've seen a MatrixTranspose function with an unused declaration for a non-existent MatrixTransposeIntoXMM function.
With a quick web search I found this for potential documentation about implementing SSE Matrix Transpose:
- http://pzemtsov.github.io/2014/10/01/how-to-transpose-a-16x16-matrix.html
- https://github.com/yatsukha/sse-matrix-transpose/blob/master/matrix_util.hpp
I also just read this Phoronix article about a Chinese initiative to fund some student summer development, and one of the proposed project is SIMD Everywhere (MIT licensed) and some proposed enhancements are about WASM SIMD128.
At first glance SIMD Everywhere seems to be a library to abstract multiple SIMD implementation:
- https://github.com/simd-everywhere/simde
About WASM SIMD128, I found that wasmer example:
- https://github.com/wasmerio/c-wasm-simd128-example
If I'm understanding those things properly, by relying on such libraries we would be able to do SIMD in game code as well. Maybe GLM has some plan to support WASM SIMD128 as well?
Here we have non-vectorized float-to-half-float function:
https://github.com/DaemonEngine/Daemon/blob/de5e21223fca39f08ed9e440954c26b72905d3af/src/engine/renderer/tr_local.h#L117-L131
Here there is a mention of _mm256_cvtps_ph intrinsic for this purpose:
https://stackoverflow.com/questions/28357977/gl-half-float-with-opengl-rendering-and-glsl/28361109#28361109
Though _mm256_cvtps_ph is AVX (we don't require AVX).
This stackoverflow answer also mention this Intel page:
https://software.intel.com/content/www/us/en/develop/articles/performance-benefits-of-half-precision-floats.html
and this header-only C++ library (MIT license) to deal with half-floats:
http://half.sourceforge.net
I see some _mm_* calls in it, so maybe SSE? It looks like they are not called on vectors though, but that may still be faster. There are also some crazy hardcoded tables…
I discovered the Real Time Math library (MIT licensed):
- https://nfrechette.github.io/2019/01/19/introducing_realtime_math/
- https://github.com/nfrechette/rtm
One good argument in favor of specialized, already vectored and already optimized libraries with explicit SIMD calls is that we would rely less on random compiler optimizations. For example, given the optimization level, compilers may unroll some loops or not, or turn some code into SIMD one or not. And then we bring compilation profiles: Debug, RelWithDebInfo, Release, picking this or that optimization level.
I have right in my hand a perfect example of unreliability. In october I profiled the game a bit with Orbit, running a debug build in order to get symbols etc. I noticed that on a common outdoor scene, the skybox eats around 30% of CPU time. So I tried to optimize that by rewriting some code in other ways, trying to help the compiler to detect some patterns and vectorize the output code.
I noticed something, before my patch, a debug build of the game produces 190 fps, but after my changes, the game produces 160 fps (what a loss!). This was not what I expected… I'll look at it but that's not the topic. What's very interesting is that both code (before and after my patch) produces the same 245 fps on Release build…
So, by taking two variants of the same code, with some build profile one variant has a 15% perf loss, with some other build profile, the perf difference is negligible… And we really need to have reliable numbers so we can compare performance properly when doing changes.