Bug in IF97 back end
Hi,
I randomly found a bug in the IF97 back end for calculation from HmassP_INPUTS at the saturated liquid state using the following inputs:
import CoolProp as CP

state = CP.AbstractState(back_end, 'water')

h = 146644.8016353955
p = 5628.620143029655
state.update(CP.HmassP_INPUTS, h, p)
state.smass() --> 505.16763080883464
h = 146644.8016353955
p = 5628.621143029655
state.update(CP.HmassP_INPUTS, h, p)
state.smass() --> 8351.93742026566
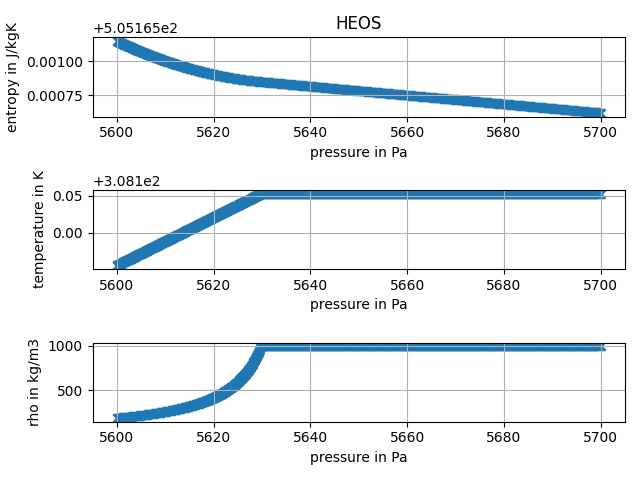
The bug does not appear in the HEOS back end:
import CoolProp as CP
import numpy as np
import pandas as pd
from matplotlib import pyplot as plt

for back_end in ['HEOS', 'IF97']:

    state = CP.AbstractState(back_end, 'water')

    h = 146644.8016353955
    p = 5628.620143029655
    state.update(CP.HmassP_INPUTS, h, p)
    print(state.smass())
    p = 5628.621143029655
    state.update(CP.HmassP_INPUTS, h, p)
    print(state.smass())

    p_min = 5600
    p_max = 5700

    p_range = np.geomspace(p_min, p_max, 1e3)

    df = pd.DataFrame(columns=['s', 'T', 'rho'])

    for p in p_range:
        try:
            state.update(CP.HmassP_INPUTS, h, p)
            df.loc[p, 's'] = state.smass()
            df.loc[p, 'T'] = state.T()
            df.loc[p, 'rho'] = state.rhomass()
        except ValueError:
            df.loc[p, 's'] = np.nan
            df.loc[p, 'T'] = np.nan
            df.loc[p, 'rho'] = np.nan

    fig, ax = plt.subplots(3, 1)

    ax[0].scatter(df.index, df['s'], marker='x')
    ax[0].grid()
    ax[0].set_xlabel('pressure in Pa')
    ax[0].set_ylabel('entropy in J/kgK')
    ax[1].scatter(df.index, df['T'], marker='x')
    ax[1].grid()
    ax[1].set_xlabel('pressure in Pa')
    ax[1].set_ylabel('temperature in K')
    ax[2].scatter(df.index, df['rho'], marker='x')
    ax[2].grid()
    ax[2].set_xlabel('pressure in Pa')
    ax[2].set_ylabel('rho in kg/m3')
    plt.tight_layout()
    fig.savefig('diagram_' + back_end +'.pdf')
    fig.savefig('diagram_' + back_end +'.png')

So I went on and tried for the liquid saturation state and tried for a (random) range of enthalpy values. There are a lot of states, where entropy and density have quite large jumps and the values are off a lot from the actual value. I'll only post the code here. If there is something I can do on this, please let me know.
Thank you for your great effort, cheers!
def plot_data(df, back_end, h):

    fig, ax = plt.subplots(3, 1)

    ax[0].set_title(back_end)
    ax[0].scatter(df.index, df['s'], marker='x')
    ax[0].grid()
    ax[0].set_xlabel('pressure in Pa')
    ax[0].set_ylabel('entropy in J/kgK')
    ax[1].scatter(df.index, df['T'], marker='x')
    ax[1].grid()
    ax[1].set_xlabel('pressure in Pa')
    ax[1].set_ylabel('temperature in K')
    ax[2].scatter(df.index, df['rho'], marker='x')
    ax[2].grid()
    ax[2].set_xlabel('pressure in Pa')
    ax[2].set_ylabel('rho in kg/m3')
    plt.tight_layout()
    fig.savefig('diagram_' + back_end + '_at_' + str(round(h)) + '.pdf')
    fig.savefig('diagram_' + back_end + '_at_' + str(round(h)) + '.png')
    plt.close()


for back_end in ['HEOS', 'IF97']:

    state = CP.AbstractState(back_end, 'water')

    h_min = 0
    T_crit = state.trivial_keyed_output(CP.iT_critical)
    p_triple = state.trivial_keyed_output(CP.iP_triple)
    p_crit = state.trivial_keyed_output(CP.iP_critical)
    p_range = np.geomspace(p_triple, p_crit, 50)

    h_range = {}

    for p in p_range:
        state.update(CP.PQ_INPUTS, p, 0)
        h_range[p] = state.hmass()

    for p_at_h, h in h_range.items():

        p_range_at_h = np.geomspace(p_at_h - 25, p_at_h + 25, 100)
        df = pd.DataFrame(columns=['s', 'T', 'rho'])

        for p in p_range_at_h:
            try:
                state.update(CP.HmassP_INPUTS, h, p)
                df.loc[p, 's'] = state.smass()
                df.loc[p, 'T'] = state.T()
                df.loc[p, 'rho'] = state.rhomass()
            except ValueError:
                df.loc[p, 's'] = np.nan
                df.loc[p, 'T'] = np.nan
                df.loc[p, 'rho'] = np.nan

        plot_data(df, back_end, h)
Please note that at a fixed Enthalpy and variable pressure, you are not at the saturated liquid state for all values of pressure. Also not that the IF97 formulation, while within 0.1% error of the Helmholtz equations, does not line up exactly with the Helmholtz saturation curve. What is happening is that some of your values are grabbing the saturated vapor state, which has a much higher entropy than the liquid state at the same pressure, causing the jumps that you see.
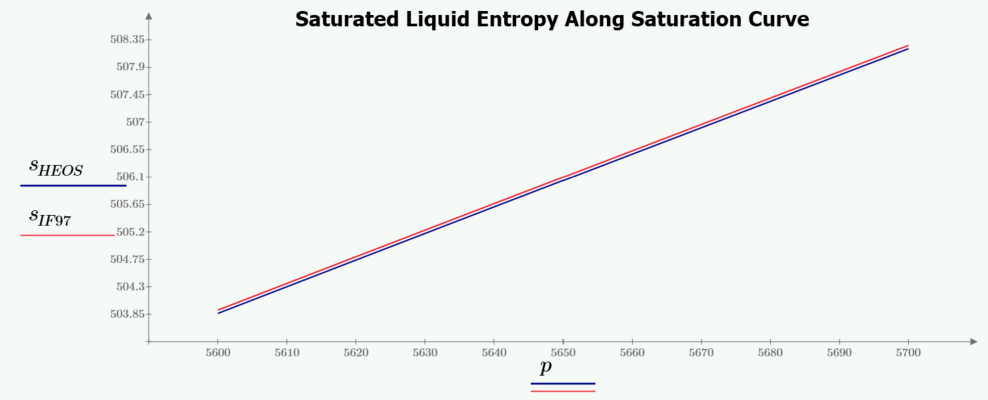
Saturated conditions should not be calculated using HmassP_INPUTS, but rather using inputs of P and Q = 0 (liquid state on the saturation curve), no matter which backend is used. This will guarantee that you are following the saturated liquid curve for all values of Pressure. Your calculated entropy values will then only be mildly in error between HEOS and IF97.
Hi Jeff, thank you for your hints.
from HmassP_INPUTS at the saturated liquid state
Please note that at a fixed Enthalpy and variable pressure, you are not at the saturated liquid state for all values of pressure.
My bad, I meant near saturation. The main reason for me using IF97 instead of HEOS is the improved calculation speed, the very small deviation does not matter too much for me.
What is happening is that some of your values are grabbing the saturated vapor state, which has a much higher entropy than the liquid state at the same pressure, causing the jumps that you see.
That would be really bad, if I understand correctly. For all (not 100 % sure) of the enthalpy inputs I tried, there should be no intersection with the saturated vapor line within the given pressure range (and especially not for the lower enthalpy values).
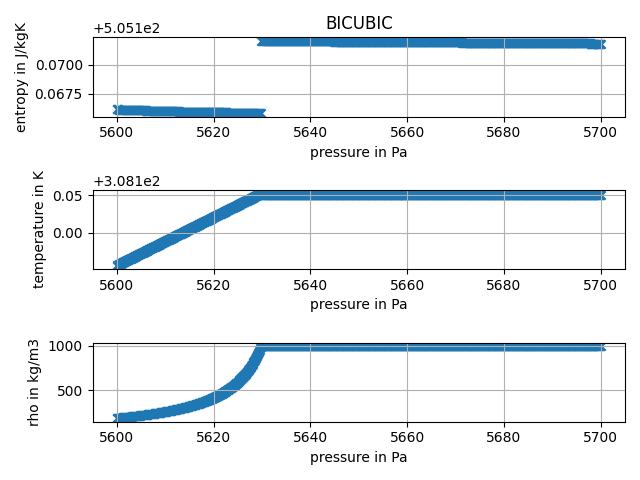
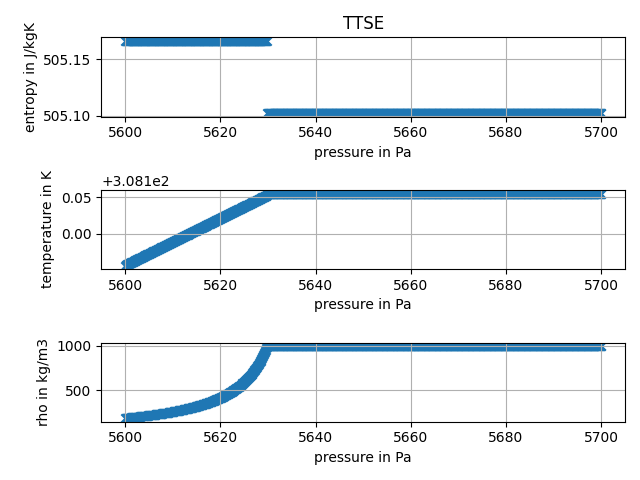
My issue is, that I need to be able to calculate the entropy from a pressure and enthalpy input for generic values, for example in order to calculate isentropic compression. Whenever I have a near saturated liquid, the IF97 will therefore very likely fail calculating a value. Btw.: TTSE and BICUBIC back ends work for these inputs. The bug does only appear in IF97.
Have a nice Easter weekend, greetings!
PPS: According to the documentation of the IF97 formulation on page 5 [1]
In addition to the basic equations, for regions 1, 2, and 4 so-called backward equations are provided in the forms of T ( p,h ) and T ( p,s ) for regions 1 and 2, and Ts ( p ) for region 4. These backward equations are numerically consistent with the corresponding basic equations and make the calculation of properties as functions of p,h and of p,s for regions 1 and 2, and of p for region 4, extremely fast. In this way, properties such as T ( p,h ), h ( p,s ), and h'( p ) can be calculated without any iteration from the backward equation alone or by combination with the corresponding basic equation, for example, h ( p,s ) via the relation h ( p,T ( p,s )).
As the issue I came across is between region 1 and 4 (for higher pressure values 2 and 4), the formulation should return consistent values for pressure and enthalpy inputs but does not (even if I calculate s(p,(T(p,h), the temperature returned by the first inputs must be wrong).
h = 146644.8016353955
p = 5628.621143029655

state = CP.AbstractState('IF97', 'water')
state.update(CP.HmassP_INPUTS, h, p)
state.update(CP.PT_INPUTS, p, state.T())
print(state.smass()) --> 8351.93742026566
print(state.hmass()) --> 2564621.0794916973
Again thank you for your time. I would really like to contribute here, but I am not really familiar with the core code of CoolProp...
I also checked with the iapws package from jjgomera (https://github.com/jjgomera/iapws). There seems to be the same issue:
from iapws import IAPWS97
state = IAPWS97(P=p, H=h)
state.s
causes an AttirbuteError and looking at the dict
state.__dict__
{'kwargs': {'T': 0.0, 'P': 5628.621143029655, 'x': None, 'h': None, 's': None, 'v': 0.0, 'l': 0.5893, 'H': 146644.8016353955}, '_thermo': ''}
[1]: Revised Release on the IAPWS Industrial Formulation 1997 for the Thermodynamic Properties of Water and Steam, IAPWS R7-97(2012), http://www.iapws.org/relguide/IF97-Rev.pdf.
Yeah, I've been thinking there's something else going on here. There's no direct S(p,h) function in IF97, so it's doing some gyrations here with an intermediate step. There may be an issue. I'll take a look at it.
@fwitte Sorry, been tied up with work. So, the left side of your range is definitely in the two-phase region. For this enthalpy, those lower pressures are in the two-phase envelope. Note that your density drops off here as it is a mixture of liquid vapor, but then goes fairly constant on the right side as you cross over the saturation curve into the liquid region.
What is odd is that right before the saturation curve, the reverse function jumps to the liquid temperature just slightly too soon, creating the discontinuity. I'm not sure if this is an issue in the underlying IF97 equations or how CoolProp/IF97 is checking for the saturation point. I get the same thing in my IF97 only Mathcad wrapper and you noted that other codes are doing the same thing, so it may be a slight mis-match between the forward and backward equations very near that saturation curve, which you are crossing.
Hi @henningjp, thank you for digging into the issue. In order to fix the mismatch one could think of something like this (given HmassP_INPUTS). Maybe it is possible to implement this in CoolProp? Obviously, it will slow down calculation speed for region 1, 3 and 4 calls for pressure < critical pressure.
If pressure below p_critical (and enthalpy below critical point enthalpy (?) as that is the highest possible value for enthalpy at the boiling line):
- Get enthalpy output from given pressure and enthalpy value pair
- Check if enthalpy of saturation at given pressure is "near" the actual enthalpy input.
- In case it is and if the relative deviation of output enthalpy to target enthalpy > threshold (I randomly chose 0.001):
- find entropy at given pressure that results in the given enthalpy numerically and return the corresponding state.
This method seems to work very well, but there are some tweaks regarding the allowed range of entropy values (see entropy_iteration function).
Basically using a similar logic as in the code snippets before, the code could look like this. Note, that no plots are generated as the deviation to the target is always lower than the threshold. Without the correction high deviation is observed on the full range of pressure.
import CoolProp as CP
import numpy as np
import pandas as pd
from matplotlib import pyplot as plt
from time import time


def entropy_iteration(state, p, h):
    state.update(CP.PQ_INPUTS, p, 0.3)
    smax = state.smass()
    state.update(CP.PQ_INPUTS, p, 0)
    if p < 1000:
        smin = 0
    elif p < 60000:
        smin = state.smass() * 0.9
    else:
        smin = state.smass() * 0.95

    d = 1e-2
    s = (smax + smin) / 2
    i = 0

    while True:
        state.update(CP.PSmass_INPUTS, p, s)
        residual = state.hmass() - h

        state.update(CP.PSmass_INPUTS, p, s + d)
        h_upper = state.hmass()

        state.update(CP.PSmass_INPUTS, p, s - d)
        h_lower = state.hmass()

        derivative = (h_upper - h_lower) / (2 * d)

        s -= residual / derivative

        if s < smin:
            s = smin + d
        elif s > smax:
            s = smax - d

        if i > 3 or abs(residual / h) < 1e-3:
            break

        i += 1

    return s, abs(residual)


def plot_data(df, back_end, h):

    fig, ax = plt.subplots(3, 1)

    ax[0].set_title(back_end)
    ax[0].scatter(df.index, df['s'], marker='x')
    ax[0].grid()
    ax[0].set_xlabel('pressure in Pa')
    ax[0].set_ylabel('entropy in J/kgK')
    f = ax[1].scatter(df.index, df['T'], marker='x', c=df['dev'])
    ax[1].grid()
    ax[1].set_xlabel('pressure in Pa')
    ax[1].set_ylabel('temperature in K')
    ax[2].scatter(df.index, df['rho'], marker='x')
    ax[2].grid()
    ax[2].set_xlabel('pressure in Pa')
    ax[2].set_ylabel('rho in kg/m3')

    plt.tight_layout()

    cbar = fig.colorbar(f, ax=ax.ravel().tolist(), shrink=0.95)
    cbar.set_label('relative deviation to target value in enthalpy', rotation=90)
    fig.savefig('diagram_' + back_end + '_at_' + str(round(h)) + '.pdf')
    fig.savefig('diagram_' + back_end + '_at_' + str(round(h)) + '.png')
    plt.close()


back_end = 'IF97'

state = CP.AbstractState(back_end, 'water')

h_min = 0
T_crit = state.trivial_keyed_output(CP.iT_critical)
p_triple = state.trivial_keyed_output(CP.iP_triple)
p_crit = state.trivial_keyed_output(CP.iP_critical)
p_range = np.geomspace(p_triple + 1, p_crit, 1000)

h_range = {}

for p in p_range:
    state.update(CP.PQ_INPUTS, p, 0)
    h_range[p] = state.hmass()

for p_at_h, h in h_range.items():

    p_range_at_h = np.geomspace(p_at_h - 25, p_at_h + 25, 100)
    df = pd.DataFrame(columns=['s', 'T', 'rho', 'dev'], index=p_range_at_h)

    for p in p_range_at_h:
        try:

            state.update(CP.HmassP_INPUTS, h, p)
            deviation = state.hmass() - h

            if abs(deviation / h) > 1e-3:
                s, deviation = entropy_iteration(state, p, h)

            df.loc[p] = state.smass(), state.T(), state.rhomass(), deviation / h

        except ValueError as e:
            print(str(e) + ', pressure value is: ' + str(p) + ' Pa.')
            pass

    if df['dev'].abs().max() > 1e-3:
        plot_data(df, back_end, h)
Then on a set of random enthalpy and pressure inputs (1000000 value pairs) for pressure < critical point pressure and enthalpy < critical point enthalpy, the numerical value adaption produces consistently good values while increasing calculation time on my machine by about 15 %.
import CoolProp as CP
import numpy as np
import pandas as pd
from matplotlib import pyplot as plt
from time import time


def entropy_iteration(state, p, h):
    state.update(CP.PQ_INPUTS, p, 0.3)
    smax = state.smass()
    state.update(CP.PQ_INPUTS, p, 0)
    if p < 1000:
        smin = 0
    elif p < 60000:
        smin = state.smass() * 0.9
    else:
        smin = state.smass() * 0.95

    d = 1e-2
    s = (smax + smin) / 2
    i = 0

    while True:
        state.update(CP.PSmass_INPUTS, p, s)
        residual = state.hmass() - h

        state.update(CP.PSmass_INPUTS, p, s + d)
        h_upper = state.hmass()

        state.update(CP.PSmass_INPUTS, p, s - d)
        h_lower = state.hmass()

        derivative = (h_upper - h_lower) / (2 * d)

        s -= residual / derivative

        if s < smin:
            s = smin + d
        elif s > smax:
            s = smax - d

        if i > 3 or abs(residual / h) < 1e-3:
            break

        i += 1

    return s, abs(residual)


back_end = 'IF97'
state = CP.AbstractState(back_end, 'water')

h_min = 0
T_crit = state.trivial_keyed_output(CP.iT_critical)
p_triple = state.trivial_keyed_output(CP.iP_triple)
p_crit = state.trivial_keyed_output(CP.iP_critical)
p_range = np.geomspace(p_triple + 1, p_crit, 1000)
state.update(CP.PT_INPUTS, p_crit, T_crit)
h_crit = state.hmass()

pressure_range = np.random.rand(1000000) * (p_crit - p_triple) + p_triple
enthalpy_range = np.random.rand(1000000) * h_crit

num_high_deviation = 0
num_high_deviation_corrected = 0

tmp = time()

for i in range(pressure_range.shape[0]):
    p = pressure_range[i]
    h = enthalpy_range[i]
    try:

        state.update(CP.HmassP_INPUTS, h, p)
        h_at_ph = state.hmass()
        deviation = abs(h_at_ph - h)
        state.update(CP.PQ_INPUTS, p, 0)
        h_sat = state.hmass()
        corrected = False

        if deviation / h > 1e-3 and abs(h - h_sat) / h_sat < 5e-2:
            s, deviation = entropy_iteration(state, p, h)
            corrected = True

        if deviation / h > 1e-3:
            num_high_deviation_corrected += corrected
            num_high_deviation += 1

    except ValueError as e:
        pass

print('Number of results with relative deviation to target value > 1e-3:', num_high_deviation)
print('Number of results with relative deviation to target value > 1e-3 after correction:', num_high_deviation_corrected)
time_with_correction = time() - tmp
tmp = time()

num_high_deviation = 0

for i in range(pressure_range.shape[0]):
    p = pressure_range[i]
    h = enthalpy_range[i]
    try:

        state.update(CP.HmassP_INPUTS, h, p)
        h_at_ph = state.hmass()
        deviation = abs(h_at_ph - h)

        if deviation / h > 1e-3:
            num_high_deviation += 1

    except ValueError as e:
        pass

print('Number of results with relative deviation to target value > 1e-3:', num_high_deviation)
time_without_correction = time() - tmp
print('Increase in calculation time:', time_with_correction / time_without_correction - 1)
Would this be interesting as an addition to CoolProp? Best regards Francesco
P. S.: In case the issue appears from saturation towards the two-phase region only (I'll need to check): Using PQ_INPUTS instead of PSmass_INPUTS iterating over the vapor mass fraction should be faster, or?
@fwitte you are more than welcome to make a PR. Otherwise I'll take a look over the summer here. I'm slammed at work right now but should have some time freed up after the end of the month. Let me know if you'd like to take this on. If you need help with contributing, take a look at the docs and the Wiki.
I will give it a try, but it might take some time as I have not worked with C++ before.
Hi @henningjp, well, some time went around. I tried to fiddle with C++, but could not really find a way to implement the algorithm into the source code, then time got scarce. Maybe someone with more C++ knowlegde can assist in implementing the code.
At least, I can report the following findings and an improved version of the fix.
- Very high deviations appear in proximity to the saturated liquid line in Region 1.
- Very high deviations appear within
Region2/3/4Region 1 where the lines of constant enthalpy are nearly tangent to the saturated gas line. - The remaining "incorrect" values are mostly for very low enthalpy values.
- The fix (see code below) has a very high success rate, maximum deviations are around 2 % to 3 %.
- On a random set of 1.000.000 values time increase is somewhere between 5 % and 10 %.
- The fix is not really "beautiful" (the code even worse) but it works, I guess.
Best regards Francesco
import CoolProp as CP
import numpy as np
from time import time


def entropy_iteration(state, p, h, smin=0, smax=0):

    d = 1e-2
    s = (smax + smin) / 2
    i = 0

    while True:
        state.update(CP.PSmass_INPUTS, p, s)
        residual = state.hmass() - h

        state.update(CP.PSmass_INPUTS, p, s + d)
        h_upper = state.hmass()

        state.update(CP.PSmass_INPUTS, p, s - d)
        h_lower = state.hmass()

        derivative = (h_upper - h_lower) / (2 * d)

        s -= residual / derivative

        if s < smin:
            s = smin + d
        elif s > smax:
            s = smax - d

        if i > 5 or abs(residual / h) < 1e-3:
            break

        i += 1

    return s, abs(residual)


back_end = 'IF97'
state = CP.AbstractState(back_end, 'water')

p_min = state.trivial_keyed_output(CP.iP_triple)
p_max = 500e5
h_min = 0
h_max = 4000000

pressure_range = np.random.rand(1000000) * (p_max - p_min) + p_min
enthalpy_range = np.random.rand(1000000) * (h_max - h_min) + h_min

p23 = 16.529164252605 * 1e6

# count number of values with high deviation
num_high_deviation = 0
# count number of remaining with high deviation
num_high_deviation_remain = 0

tmp = time()

# iteration of pressure and enthalpy
for i in range(pressure_range.shape[0]):
    p = pressure_range[i]
    h = enthalpy_range[i]
    try:

        state.update(CP.HmassP_INPUTS, h, p)
        h_at_ph = state.hmass()
        deviation = abs(h_at_ph - h)

        # check deviation
        if p <= p23 and deviation / h > 0.001:
            num_high_deviation += 1

            # region 1, where isenthalpic lines are tangent to saturation dome
            if p > 1e6 and p < 1e7 and h > 2700000 and h < 2850000:
                smin = 5750
                smax = 6500
            else:
                # bottom left corner in Ts diagram
                if h < 10000:
                    smin = 0
                    smax = 50
                else:
                    # proximity to saturated liquid
                    state.update(CP.PQ_INPUTS, p, 0)
                    h_sat_l = state.hmass()
                    if abs(h - h_sat_l) / h_sat_l < 1e-1:
                        if p < 1000:
                            smin = 0
                        elif p < 60000:
                            smin = state.smass() * 0.9
                        else:
                            smin = state.smass() * 0.95

                        state.update(CP.PQ_INPUTS, p, 0.3)
                        smax = state.smass()
                    # all others
                    else:
                        state.update(CP.HmassP_INPUTS, h, p)
                        s0 = state.smass()
                        smin = 0.8 * s0
                        smax = 1.2 * s0

            s, deviation = entropy_iteration(state, p, h, smin=smin, smax=smax)

        # check deviation after recalculation
        if deviation / h > 0.001:
            num_high_deviation_remain += 1

    except ValueError as e:
        # catch out of range errors
        pass

print('Number of results with relative deviation to target value > 1e-3:', num_high_deviation)
print('Number of results with relative deviation to target value > 1e-3 after correction:', num_high_deviation_remain)
time_with_correction = time() - tmp

# same thing, now without fix, see how time changes
tmp = time()

num_high_deviation = 0

for i in range(pressure_range.shape[0]):
    p = pressure_range[i]
    h = enthalpy_range[i]
    try:

        state.update(CP.HmassP_INPUTS, h, p)
        h_at_ph = state.hmass()
        deviation = abs(h_at_ph - h)

        if deviation / h > 1e-3:
            num_high_deviation += 1

    except ValueError as e:
        pass

print('Number of results with relative deviation to target value > 1e-3:', num_high_deviation)
time_without_correction = time() - tmp
print('Increase in calculation time:', time_with_correction / time_without_correction - 1)
Thanks @fwitte. I may have some self-quarantine time coming up to look at this again. Your code will give me a good start.
@fwitte It's been a while, but I think I have sorted out what is going on and am implementing a fix for it in IF97 (stand-alone). I can then get that implemented in the IF97 Backend in CoolProp. Here's what I've found:
- The backward function T(p,s) and T(p,h) have an RMS error of roughly ±6 mK, with maximum errors around ±25 mK. These occur, for the most part, near the saturation curve at low pressures/temperatures (like your example above), near the region 1/3 boundary along the saturation curve, and all around the critical point.
- For PH and PS pairs very near the saturation curve, this small uncertainty of ±25 mK can result temperatures that are just slightly on the other side of the saturation curve, in the wrong phase. This causes evaluation of other properties using that temperature and pressure to generate values from the wrong phase with very incorrect results.
- Forcing the subsequent property calculations from the "correct" phase equations (based on [p, h] or [p, s]) results in entropies (±0.25 J/kg-K) and enthalpies (±200 J/kg-K), both within ±0.01% error on average from the forward equation values. However, near triple point temperature (across entire valid pressure range), where the entropy/enthalpy values drop off in the Liquid region, these relative errors can grow by an order of magnitude to ±0.1% or more.
Correction strategy is this:
- Limit reverse calculated temperature to Tsat ± a very small increment to make sure that T is on the correct side of the saturation curve. Subsequent property evaluations with the temperature result will yield properties in the correct phase. This will however create a discontinuity at the saturation curve because of the above mentioned uncertainty in the reverse equations.
- Implement h(p, s), s(p, h), ρ(p, s) and ρ(p, h) functions in the IF97 API. These functions use the actual reverse temperatures all the way up to the saturation curves, but force use of the forward h(Tcalc, p) or s(Tcalc, p) evaluation using the correct region equations. This removes the discontinuity at the saturation curves, but propagates the Region 1/2 uncertainty in the reverse equations into the two-phase region.
Using this strategy, your plots above are reproduced here (directly from IF97 using the Mathcad wrapper):
This should make the reverse IF97 functions of S and H much more robust. Any comments on this strategy from you or @ibell ? If not, I'll go ahead and integrate into IF97 and then pull it into the CoolProp backend.