ClemBot
 ClemBot copied to clipboard
Weather Cog: Improve Usability
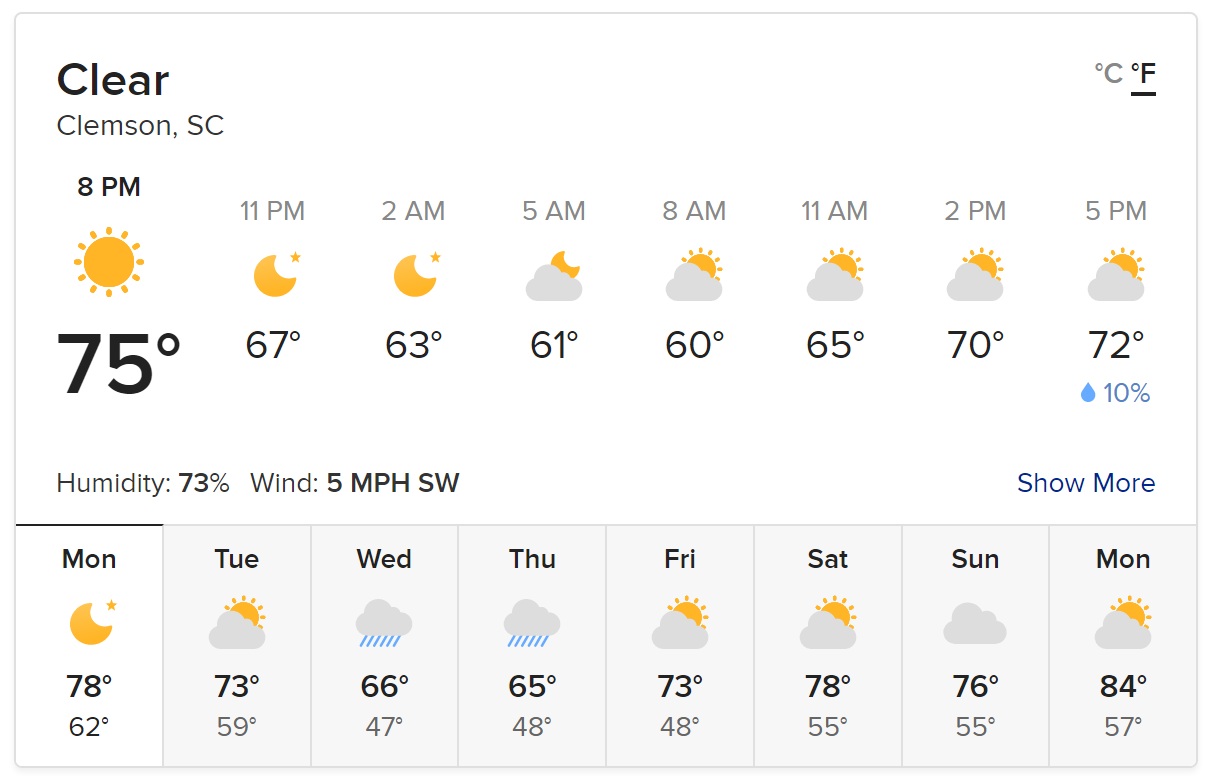
For seeing what the weather is going to be like over time, especially for hour by hour, it is not particularly easy to at-a-glance figured out what is happening with the weather over time.
My thought (which I'd like feedback on) is to create charts visualizing the information to make it easier and quicker to process.
Potential plots:
- Temperature
- Wind speed
- Humidity
- Precipitation chance
- Condition (this one might be tricky to visualize since it incorporates not just cloud cover but also precipitation other factors)
Another thought I had was listing single attributes (such as temperature) in order of time on a single page (or consecutive pages) to improve digestibility.
What do y'all think?
I LOVE THIS IDEA
I'm thinking something like the duckduckgo search results? We could piece together the images from assets. We could even add a M T W Th F Sa Su emote? Although, I don't know how you feel about that particular addition.