plot_history_alive does not start to decline
Hello,
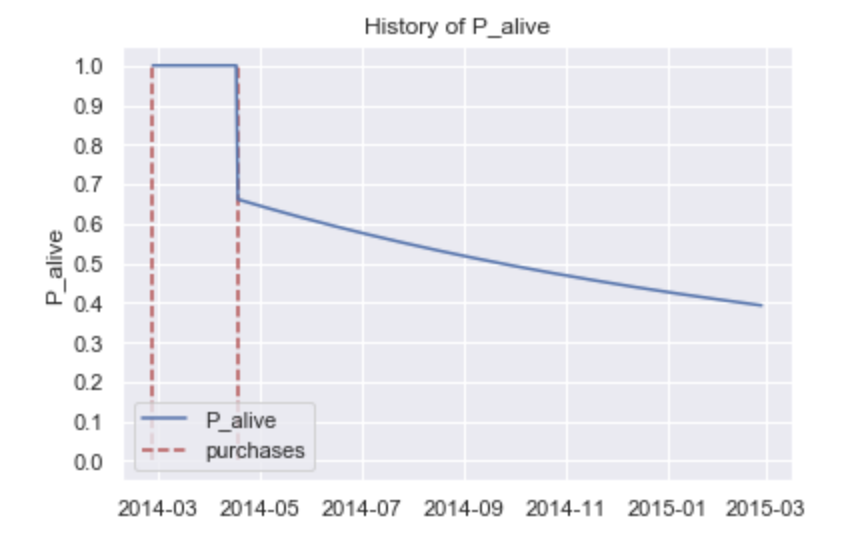
Maybe my interpretation is wrong, but it looks to me that the P_alive probability stays constant between the first and the 2nd transaction. Then between following transactions, the decline is nicely happening.
To me this behaviour does not look to be correct.
I don't know exactly why this is happening, but I do remember that an important detail about most of the models in this library is that they use repeat purchases, i.e. they are only defined for purchases >= 1 (0 repeat purchases = 1 purchase). So my guess is that 0 purchases is "hard-coded" to be the same as 1 purchase (0 repeat purchases).
For others to be able to help more effectively, please post a sample of the dataset you're using and the code also.
the code is shown below: the plotted 'customer' has done 2 transactions in 03/2014 and 05/2014 shown in red dashed vertical lines. The proability curve to be considered 'dead' is in blue and one can see that between the 2 transactions the probability to be 'dead' is staying 1, which is wrong in my opinion.
`from lifetimes.plotting import plot_history_alive
id = 16078
days_since_birth = 365
sp_trans = df.loc[df['customer_id'] == id]
plot_history_alive(bgf, days_since_birth, sp_trans, 'date')`
Can you provide the full bit of code?
For the fit model, if you have bgf.params_, and then you also have the details for the single record id=16078, it should be enough to reproduce.
(Perhaps the bgf model was fit with a non-zero penalizer giving rise to unusual coefficients? So you might make note of what the penalizer was.)
https://github.com/CamDavidsonPilon/lifetimes/issues/173 may provide some further information