KMUnicate style of "add_at_risk_counts" does not work with weighted fit
Hello Cameron,
First of all thank you very much for your great job at lifelines. I have been using lifelines for quite some time. Since the introduction of the KMUnicate, I understood my Kaplan-Meier curves are not working fully as before (The numbers at the bottom of the figure also change which should be the same. ) I understood this happens when I am using the weights in the fit method. If the weights are dropped or just 1. There is no issue.
km = KaplanMeierFitter() km.fit(T, event_observed=E, timeline=t, weights=df['w']) km.plot()
Do you have any idea why this happens?
Thank you, Danial
Hi @Senejohnny, can you describe what you expect to see versus what you currently see?
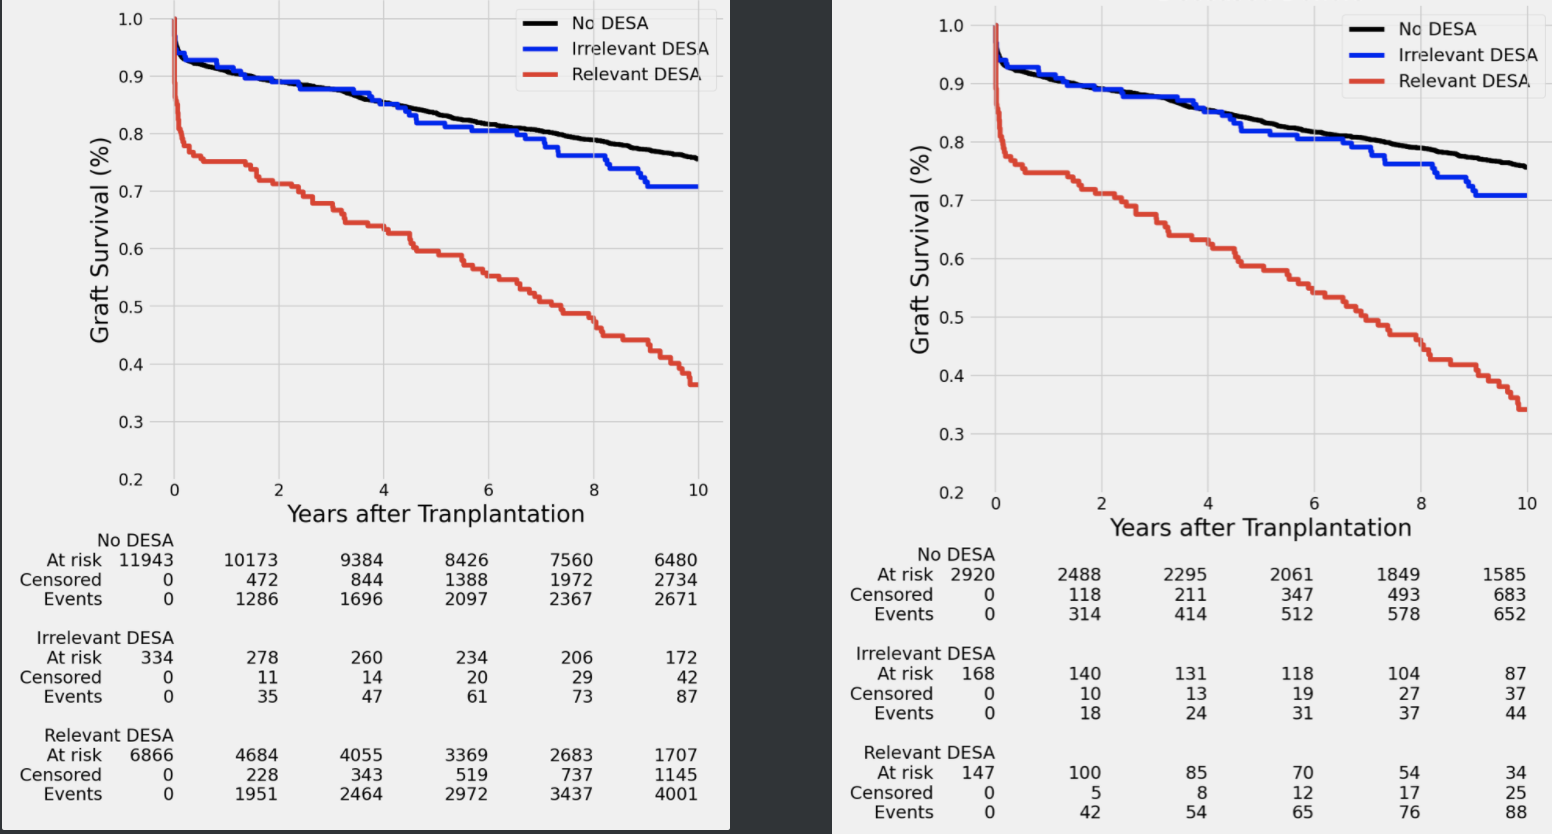
Thanks @CamDavidsonPilon for your reply. I expect to see always the risk counts in the right figure. But, when I use a weighting, I get the strange risk count in the left. I guess the weights are also multiplied by the risk counts.
And your weights are "counts", like a 2 represents two subjects? Or are they floats, e.g. in a inverse probability model?
Is there any update on this? When using Adjusted Kaplan Meier (AKM) with weights "add_at_risk_counts" demonstrate a different population. Is this the pseudo population? Is there a way we still get the original population?
I will open a new issue on this