Thold report wrong traffic values
Interface of the device is: 1Gbps
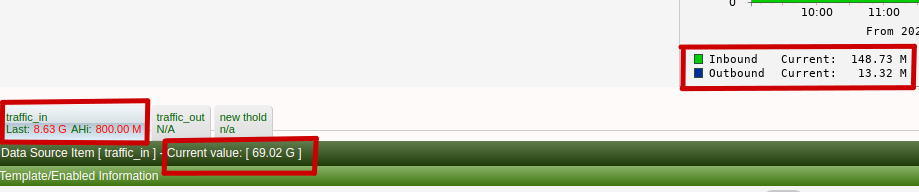
Current Inbound traffic on the graph is: 148.73 M - this is OK, no problem here.
My problem is in Thold plugin:
Current traffic on the thold is: 69.02 G
"traffic_in last:" 8.63 G and send alert "...above threshold of 800 M"
Why is there such a big difference from the real value? How to calculate it correctly?
The problem exists on different brands of devices - Cisco Switches, etc.
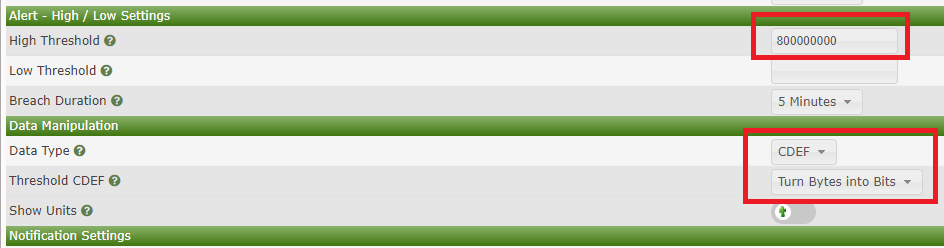
Screenshot in Thold edit:
Cacti Version: 1.2.19 - clear installation - no updates installed
Monitor Plugin Version: Latest from GitGub - 2.5
Thold Plugin Version: Latest from github - 1.5.2, but after installation in Configuration - Plugins is version 1.6 Source: https://github.com/Cacti/plugin_thold.git
Poller Type: Spine - v. 1.2.19
OS: Debian 11.1
PHP: 7.4.25
MariaDB: 10.5.12
Thank you!
I still can't find a solution.
128 Mbps real inbound traffic, but thold values are wrong:
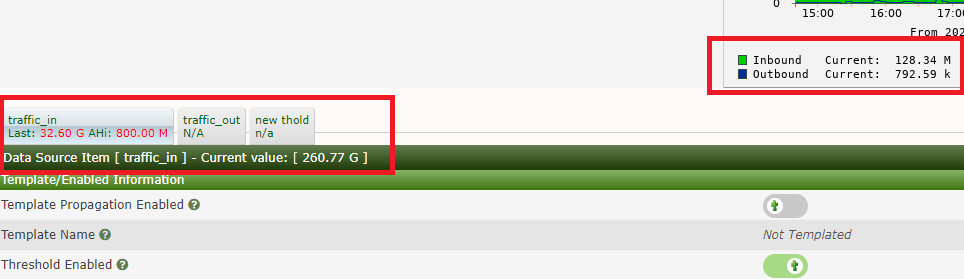
thold settings:
After downgrade thold plugin to v1.5.2 everything is correct and there are no more problems with current traffic values. :)
Hope one day the cacti team is able to give advise on how to troubleshoot this type of issues. Someone mentioned something about 32 to 64 bit architectures on rrds, no idea how to verify.
The currently issue I am seeing on latest Dev Thold is traffic levels are certain values is still okay.. Those graphs that is 500Mbits and above, the values go haywire. Using the same settings as OP, CDEF - Turn Bytes to Bits.