Thold is broken in current Cacti database
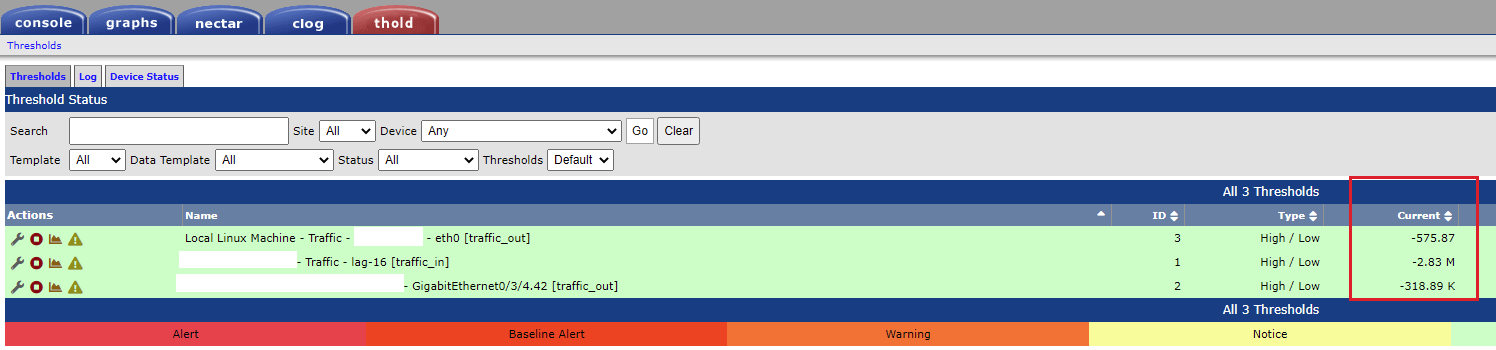
Describe the bug Thold interface speed current value is wrong and is negative in value.
To Reproduce Steps to reproduce the behavior: Use current cacti database. I can confirm that the bug is related to the cacti backup. Restored the backup in a new VM and the problem still happens.
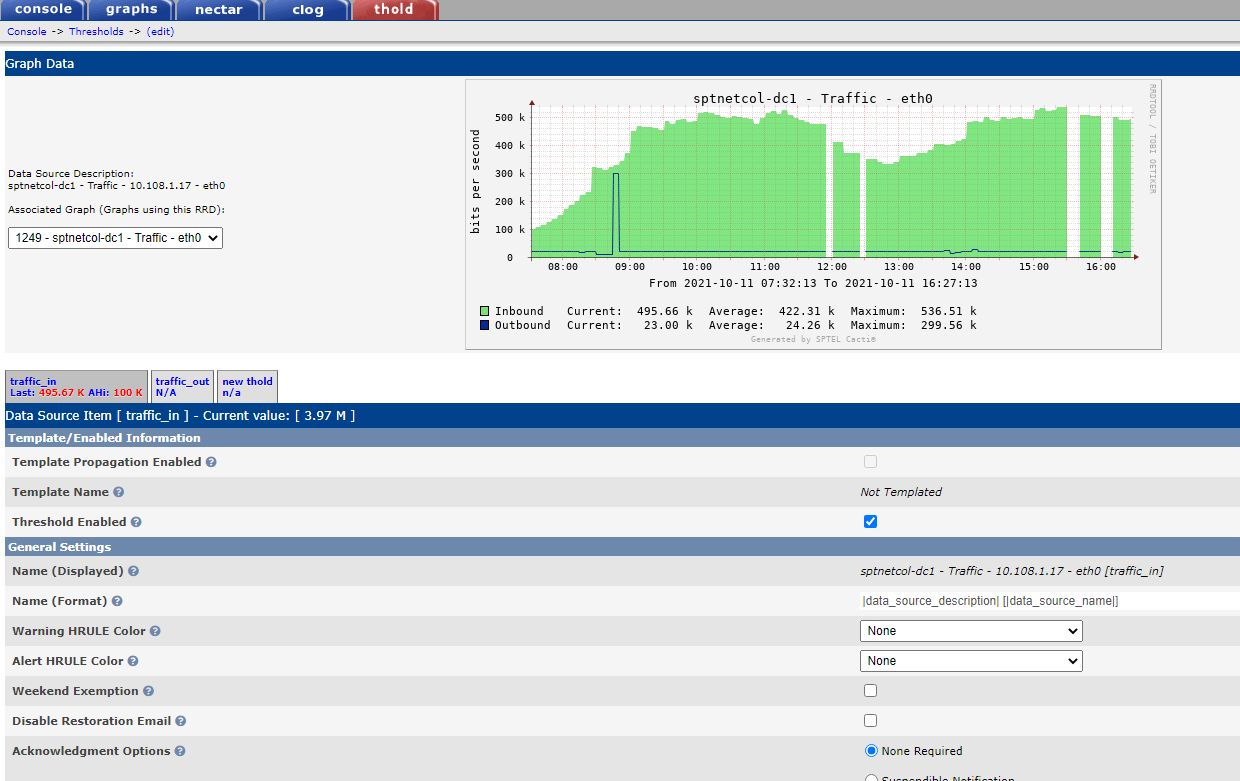
On a new fresh install of cacti 1.2.17 and Thold 1.5.3, the Thold current values is correct, following graphs.
Screenshots
@TheWitness , Can advise what can cause this bug to be saved in the cacti database ? How can I troubleshoot this issue. Is there some Thold settings i need to purge from the Cacti database ?
You said you backed and restored the database? Does that include the RRD's? Did you move between 32-bit and 64-bit architecture? If so, there's a more convoluted process than just a copy and restore.
Migrated from RHEL to Centos 7 to see if it makes a difference. Yeah the standard cacti back and restore process. But I noted since the backup/restore is both on cacti 1.2.17 it does not trigger and database upgrade process.
Can advise what is the correct process to do this ?
You said you backed and restored the database? Does that include the RRD's? Did you move between 32-bit and 64-bit architecture? If so, there's a more convoluted process than just a copy and restore.
It's hard to say without fully investigating your setup. If you did move your RRD's between 32-bit and 64-bit processors, there is an export and import options on rrdtool to allow proper migration. If you do a google search on that you should get some hits.
@netniV , not this is not processor related since Thold seems to work on new refresh database. The graphs are working fine. Is there a way clean all previous Thold plugin settings in cacti database ? I suspect something might be left over and interfering.
I want to add my issue to this request cause it seems related. I've migrated servers (redhat 7 to 8) and versions (1.1.28 to 1.2.17), exporting rrd files to xml and back again. Thold version 1.5.2
All "hrstoragetable" graph seem to be having issues with the current version off thold:

To make sure I didn't have issues with the rrd => xml =>rrd transformations i created new rrd files on the new installation.
The problem is present there aswell.
To make it even more interesting: the "normal" used disk space template does not give issues with thold:

the graph is being rendered perfectly fine (for both used space and hrstorage). Any alerts for the used space are sent, but not for the hrstorage (even if you see it being in status breached)
Let me know if you need additional info.
Not too sure about this one. If using the host-mib, there are some snmpd.conf settings that you may have to tweak in order to report perfect numbers, you already say that the values reported on the graphs are correct. We simply don't have enough information about your setting to make a determination. Might be a CDEF, but again, hard to say. If you were using the thold_daemon, I would say take a fresh snapshot of the thold develop branch and try again.
Not too sure about this one. If using the host-mib, there are some snmpd.conf settings that you may have to tweak in order to report perfect numbers, you already say that the values reported on the graphs are correct. We simply don't have enough information about your setting to make a determination. Might be a CDEF, but again, hard to say. If you were using the thold_daemon, I would say take a fresh snapshot of the thold develop branch and try again.
--
On my test cacti upgraded to Cacti 1.2.18 and Latest developer thold 1.6.0. Wow... Looks like the thold negative values issue is fixed ! Nee to test on my production cacti.
Hmmm.. Unfortunately found Cacti+spine 1.2.18 polling was unstable and had to rollback. Tried testing Thold 1.6 plugin + Cacti 1.2.17 but it seems the bug is still there. Need to wait for stable version of Cacti i guess to test again.
Closing this. I think this issue has been addressed in a few different commits. So, assuming its fixed.