THOLD Daemon V1.4 poor performance
Hey Everyone
So I have been wanting to migrate over to using the threshold dameon but I am not having good luck using the daemon I find that when I am using it tholds are not triggering
Here is the output I get using the daemon
2020/12/09 11:16:27 - SYSTEM THOLD DAEMON STATS: TotalTime:30.402 MaxRuntime:1.390 Processed:192 InProcess:480325 TotalDevices:15365 DownDevices:134 NewDownDevices:0 MaxProcesses:30 Completed:38 Running:10 Broken:0
2020/12/09 11:15:28 - SYSTEM THOLD DAEMON STATS: TotalTime:30.988 MaxRuntime:1.504 Processed:505 InProcess:448846 TotalDevices:15365 DownDevices:134 NewDownDevices:0 MaxProcesses:30 Completed:37 Running:10 Broken:0
2020/12/09 11:14:29 - SYSTEM THOLD DAEMON STATS: TotalTime:34.128 MaxRuntime:2.067 Processed:359 InProcess:417755 TotalDevices:15365 DownDevices:135 NewDownDevices:0 MaxProcesses:30 Completed:41 Running:10 Broken:0
2020/12/09 11:13:31 - SYSTEM THOLD DAEMON STATS: TotalTime:46.016 MaxRuntime:7.641 Processed:525 InProcess:391875 TotalDevices:15365 DownDevices:135 NewDownDevices:0 MaxProcesses:30 Completed:47 Running:10 Broken:0
2020/12/09 11:12:32 - SYSTEM THOLD DAEMON STATS: TotalTime:51.750 MaxRuntime:7.569 Processed:502 InProcess:367011 TotalDevices:15365 DownDevices:135 NewDownDevices:0 MaxProcesses:30 Completed:46 Running:10 Broken:0
2020/12/09 11:11:31 - SYSTEM THOLD DAEMON STATS: TotalTime:42.232 MaxRuntime:2.936 Processed:630 InProcess:348251 TotalDevices:15365 DownDevices:134 NewDownDevices:0 MaxProcesses:30 Completed:49 Running:10 Broken:0
2020/12/09 11:10:30 - SYSTEM THOLD DAEMON STATS: TotalTime:32.247 MaxRuntime:1.254 Processed:277 InProcess:335974 TotalDevices:15365 DownDevices:135 NewDownDevices:0 MaxProcesses:30 Completed:42 Running:10 Broken:0
Here is the system service setting I am using
[Unit]
Description=Cacti Threshold Daemon Service
After=network.target auditd.service mariadb.service php7.0-fpm.service nginx.service

[Service]
Type=forking
User=apache
Group=apache
ExecStart=/usr/bin/php -q /var/www/html/cacti/plugins/thold/thold_daemon.php
KillMode=process
Restart=on-failure

[Install]
WantedBy=multi-user.tar
When I switch back to not using the daemon everything works just fine no errors are showing in log in both cacti log and syslog
Here is the status of the daemon
[root@<hostname> ~]# systemctl status thold_daemon -l
● thold_daemon.service - Cacti Threshold Daemon Service
   Loaded: loaded (/etc/systemd/system/thold_daemon.service; disabled; vendor preset: disabled)
   Active: active (running) since Wed 2020-12-09 10:10:39 EST; 1h 32min ago
  Process: 13701 ExecStart=/usr/bin/php -q /var/www/html/cacti/plugins/thold/thold_daemon.php (code=exited, status=0/SUCCESS)
 Main PID: 13726 (php)
   CGroup: /system.slice/thold_daemon.service
           └─13726 /usr/bin/php -q /var/www/html/cacti/plugins/thold/thold_daemon.php

Dec 09 10:10:39 <hostname> systemd[1]: Starting Cacti Threshold Daemon Service...
Dec 09 10:10:39 <hostname> php[13701]: Starting Thold Daemon ... [OK]
Dec 09 10:10:39 <hostname> systemd[1]: Started Cacti Threshold Daemon Service.
I also noticed that the boost timing and poller timings increase when the daemon is in use I Also noticed that eventually a couple of tholds trigger but it took much much longer using the daemon that the standard poller
I think I got it even though there were no errors or complaints from thold I went back and found that the thold_daemon.php didn't have execute permissions I changed that now it looks good
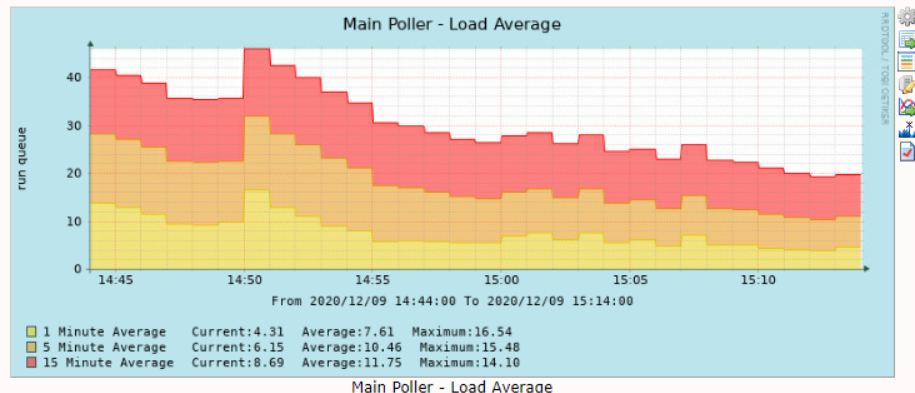
OK so its is working but I don't think that permission was the issue I notice the daemon eats heavily into resources specs of this VM are 16CPU and 16G ram
as soon as I turn on the daemon the resource usage goes through the roof
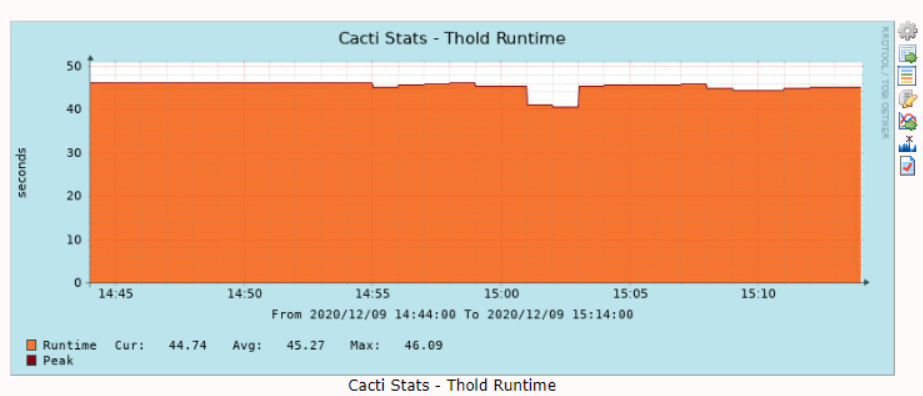
2020/12/09 14:57:03 - SYSTEM THOLD STATS: Time:45.7798 Tholds:71799 TotalDevices:15365 DownDevices:132 NewDownDevices:0
2020/12/09 14:56:05 - SYSTEM THOLD STATS: Time:44.9228 Tholds:72205 TotalDevices:15365 DownDevices:132 NewDownDevices:0
2020/12/09 14:54:28 - SYSTEM THOLD DAEMON STATS: TotalTime:266.853 MaxRuntime:3.592 Processed:48186 InProcess:17793 TotalDevices:15365 DownDevices:132 NewDownDevices:0 MaxProcesses:10 Completed:273 Running:2 Broken:0
2020/12/09 14:53:28 - SYSTEM THOLD DAEMON STATS: TotalTime:299.772 MaxRuntime:3.695 Processed:47586 InProcess:19849 TotalDevices:15365 DownDevices:132 NewDownDevices:0 MaxProcesses:10 Completed:335 Running:2 Broken:0
2020/12/09 14:52:31 - SYSTEM THOLD DAEMON STATS: TotalTime:302.309 MaxRuntime:3.350 Processed:54276 InProcess:12606 TotalDevices:15365 DownDevices:132 NewDownDevices:0 MaxProcesses:10 Completed:352 Running:29 Broken:0
2020/12/09 14:51:30 - SYSTEM THOLD DAEMON STATS: TotalTime:368.468 MaxRuntime:4.258 Processed:51287 InProcess:18549 TotalDevices:15365 DownDevices:132 NewDownDevices:0 MaxProcesses:10 Completed:305 Running:2 Broken:0
Memory Usage was also pretty high while daemon is running
              total        used        free      shared  buff/cache   available
Mem:            15G        8.1G        250M         32M        7.2G        7.1G
Swap:          8.0G        142M        7.9G
After shutting it down
              total        used        free      shared  buff/cache   available
Mem:            15G        7.5G        1.1G         32M        6.9G        7.7G
Swap:          8.0G        142M        7.9G
Ok I enabled slow log in our Lab the only thing that comes up is
use cacti;
SET timestamp=1607956457;
SELECT GET_LOCK('poller_boost', 1);


# Time: 201214  9:36:23
# User@Host: cacti[cacti] @ localhost []
# Thread_id: 17947884  Schema: cacti  QC_hit: No
# Query_time: 1.000172  Lock_time: 0.000000  Rows_sent: 1  Rows_examined: 0
# Rows_affected: 0  Bytes_sent: 82
SET timestamp=1607956583;
SELECT GET_LOCK('poller_boost', 1);
# Time: 201214  9:38:22
# User@Host: cacti[cacti] @ localhost []
# Thread_id: 17953068  Schema: cacti  QC_hit: No
# Query_time: 1.000111  Lock_time: 0.000000  Rows_sent: 1  Rows_examined: 0
# Rows_affected: 0  Bytes_sent: 82
SET timestamp=1607956702;
SELECT GET_LOCK('poller_boost', 1);
# Time: 201214  9:40:21
# User@Host: cacti[cacti] @ localhost []
# Thread_id: 17958279  Schema: cacti  QC_hit: No
# Query_time: 1.000390  Lock_time: 0.000000  Rows_sent: 1  Rows_examined: 0
# Rows_affected: 0  Bytes_sent: 82
SET timestamp=1607956821;
SELECT GET_LOCK('poller_boost', 1);
# Time: 201214  9:42:28
# User@Host: cacti[cacti] @ localhost []
# Thread_id: 17963408  Schema: cacti  QC_hit: No
# Query_time: 1.000118  Lock_time: 0.000000  Rows_sent: 1  Rows_examined: 0
# Rows_affected: 0  Bytes_sent: 82
SET timestamp=1607956948;
The only difference is that in Lab we have 1200 thresholds but in prod its 76k so I am not sure if its a thing of scaled I can get a window to enable slow query in Prod and get back to you