CLOG Search filter discrepancy
Actually, it shouldn't. it's a regex field so the dots in your second search relate to any char.
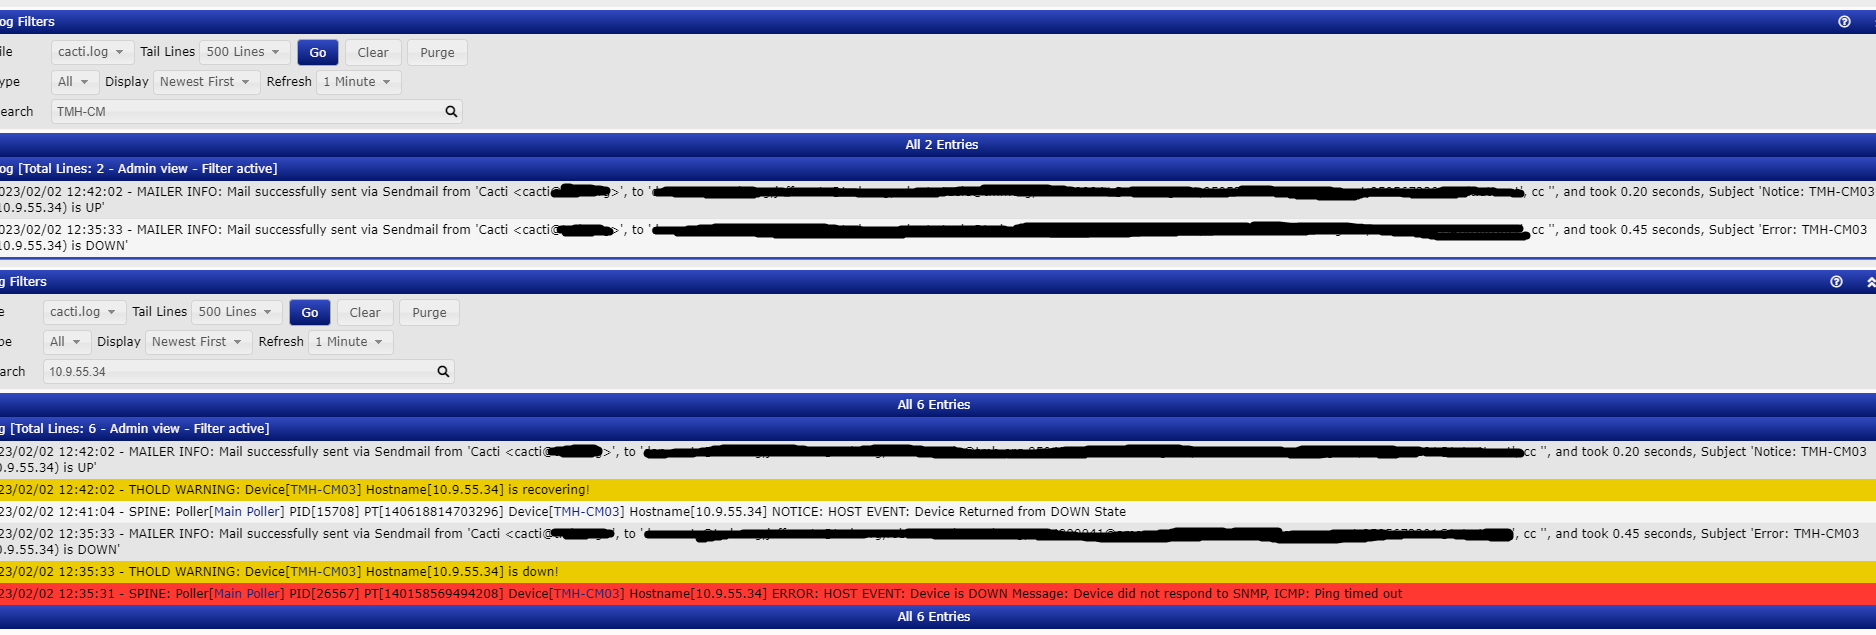
so the regex is wrong and requires users to do something other than expected? It finds all of the IP's it does not find all of the names...
That is hard to say without having access to the source data. Try adding a backslash before the hyphen, the hyphen can be treated as a special char in certain circumstances.
@thewitness this was not about dots and the regex @netniV mentioned. The dots in the IP address did find all of the IP's however the first search for TMH-CM did not return the same lines that you see in the IP search which did in fact contain the string TMH-CM.
If you can send me a copy of a log file with the problem via email, I will try and replicate
@netniV and @thewitness I probably dont need to provide the log to provide the information necessary now that I have grabbed the log and found that the data is not printed to the raw cacti log either.
clog shows this
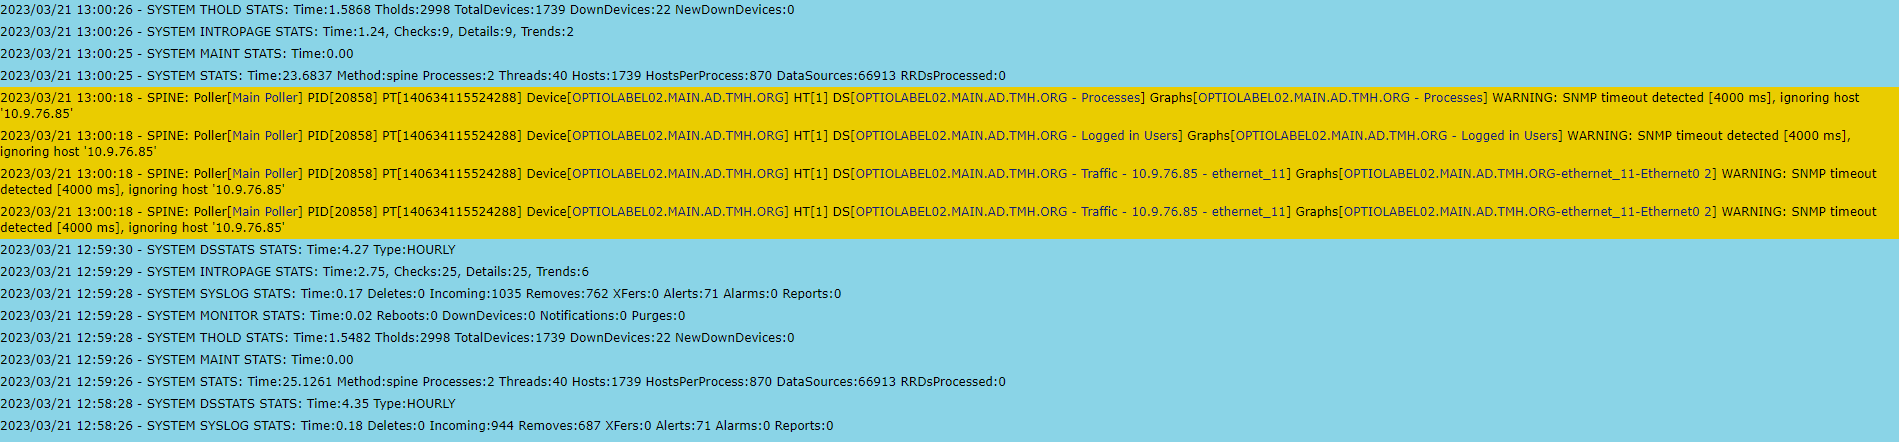 but raw cacti log does not have the spine poller messages the same way so a search for OPTIOLABEL will not return results. The same with my previous example with TMH-CM
2023/03/21 12:59:26 - SYSTEM STATS: Time:25.1261 Method:spine Processes:2 Threads:40 Hosts:1739 HostsPerProcess:870 DataSources:66913 RRDsProcessed:0
2023/03/21 12:59:26 - SYSTEM MAINT STATS: Time:0.00
2023/03/21 12:59:28 - SYSTEM THOLD STATS: Time:1.5482 Tholds:2998 TotalDevices:1739 DownDevices:22 NewDownDevices:0
2023/03/21 12:59:28 - SYSTEM MONITOR STATS: Time:0.02 Reboots:0 DownDevices:0 Notifications:0 Purges:0
2023/03/21 12:59:28 - SYSTEM SYSLOG STATS: Time:0.17 Deletes:0 Incoming:1035 Removes:762 XFers:0 Alerts:71 Alarms:0 Reports:0
2023/03/21 12:59:29 - SYSTEM INTROPAGE STATS: Time:2.75, Checks:25, Details:25, Trends:6
2023/03/21 12:59:30 - SYSTEM DSSTATS STATS: Time:4.27 Type:HOURLY
2023/03/21 13:00:18 - SPINE: Poller[1] PID[20858] PT[140634115524288] Device[571] HT[1] DS[1195] WARNING: SNMP timeout detected [4000 ms], ignoring host '10.9.76.85'
2023/03/21 13:00:18 - SPINE: Poller[1] PID[20858] PT[140634115524288] Device[571] HT[1] DS[1195] WARNING: SNMP timeout detected [4000 ms], ignoring host '10.9.76.85'
2023/03/21 13:00:18 - SPINE: Poller[1] PID[20858] PT[140634115524288] Device[571] HT[1] DS[1196] WARNING: SNMP timeout detected [4000 ms], ignoring host '10.9.76.85'
2023/03/21 13:00:18 - SPINE: Poller[1] PID[20858] PT[140634115524288] Device[571] HT[1] DS[1197] WARNING: SNMP timeout detected [4000 ms], ignoring host '10.9.76.85'
2023/03/21 13:00:25 - SYSTEM STATS: Time:23.6837 Method:spine Processes:2 Threads:40 Hosts:1739 HostsPerProcess:870 DataSources:66913 RRDsProcessed:0
2023/03/21 13:00:25 - SYSTEM MAINT STATS: Time:0.00
2023/03/21 13:00:26 - SYSTEM INTROPAGE STATS: Time:1.24, Checks:9, Details:9, Trends:2
2023/03/21 13:00:26 - SYSTEM THOLD STATS: Time:1.5868 Tholds:2998 TotalDevices:1739 DownDevices:22 NewDownDevices:0
2023/03/21 13:00:26 - RCONFIG DEBUG: Executing '/usr/bin/php' with arguments ' -q /var/www/localhost/htdocs/cacti/plugins/routerconfigs/router-download.php --retry'
2023/03/21 13:00:26 - RCONFIG STATS: Backup now running since 2023-03-21 13:00:26
2023/03/21 13:00:26 - RCONFIG STATS: Time:0.00 Downloaded:0 Failed:0
2023/03/21 13:00:26 - SYSTEM MONITOR STATS: Time:0.02 Reboots:0 DownDevices:0 Notifications:0 Purges:0
2023/03/21 13:00:27 - SYSTEM SYSLOG STATS: Time:0.16 Deletes:0 Incoming:1003 Removes:770 XFers:0 Alerts:71 Alarms:0 Reports:0
2023/03/21 13:00:29 - SYSTEM DSSTATS STATS: Time:4.34 Type:HOURLY
2023/03/21 13:01:28 - SYSTEM STATS: Time:26.9354 Method:spine Processes:2 Threads:40 Hosts:1739 HostsPerProcess:870 DataSources:66913 RRDsProcessed:0
2023/03/21 13:01:29 - SYSTEM MAINT STATS: Time:0.00
2023/03/21 13:01:30 - SYSTEM THOLD STATS: Time:1.5267 Tholds:2998 TotalDevices:1739 DownDevices:22 NewDownDevices:0
2023/03/21 13:01:30 - SYSTEM MONITOR STATS: Time:0.02 Reboots:0 DownDevices:0 Notifications:0 Purges:0
2023/03/21 13:01:30 - SYSTEM SYSLOG STATS: Time:0.19 Deletes:0 Incoming:1070 Removes:782 XFers:0 Alerts:71 Alarms:0 Reports:0
2023/03/21 13:01:33 - SYSTEM DSSTATS STATS: Time:4.24 Type:HOURLY
2023/03/21 13:01:36 - SYSTEM INTROPAGE STATS: Time:7.72, Checks:18, Details:18, Trends:22
2023/03/21 13:02:24 - SYSTEM STATS: Time:23.0695 Method:spine Processes:2 Threads:40 Hosts:1739 HostsPerProcess:870 DataSources:66913 RRDsProcessed:0
2023/03/21 13:02:24 - SYSTEM MAINT STATS: Time:0.01
Same with THOLD messages. Cacti raw log shows
2023/03/21 14:00:26 - THOLD WARNING: Device[2626] Hostname[10.6.33.77] is down!
clog shows
 so a clog search does not display the "names" printed in clog because its searching cacti raw log?
I reopened this as I believe that 1.3.x still has a bug regarding this, but it will not be fixed in 1.2.x
Reading this again, JD is saying that if you search for an IP, you should also match the hostname that matches that IP and vice versa. I guess it makes sense.
Yes. I believe they would work in 1.3. Well at least source text vs mapped text. It won't resolve IPs etc just the expected name for a given ID