vcs
 vcs copied to clipboard
Published
20 hours ago •
 CDAT
CDAT
Colormap for difference or anomaly field needs adjustment
When you see colorbar at range of [-10, 0] and [0, 10], you will see both colors are same. It looks like colors are somehow shifted by using 16, 240 range.
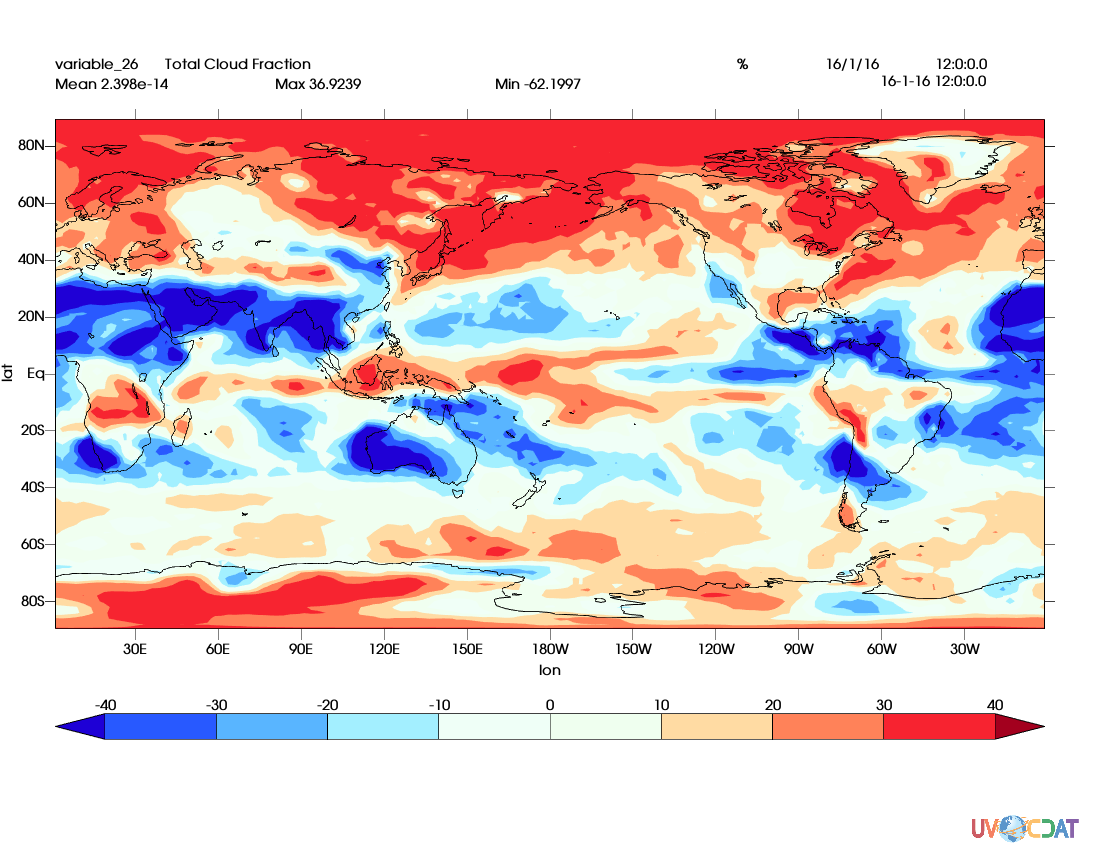
It is expected to have colorbar something like below. You will notify colors are contrasted at zero.

Below is a plotting code for above-most image.
import vcs, MV2, cdms2, cdutil

# Open sample file
f = cdms2.open('clt.nc')
d = f('clt',time=slice(0,1))

# Get anomaly field to have negative values
d_anom = MV2.subtract(d, cdutil.averager(d,axis='xy'))
d_anom.setAxis(0,d.getAxis(0))
d_anom.setAxis(1,d.getAxis(1))
d_anom.setAxis(2,d.getAxis(2))

# Plot
x = vcs.init()
iso = vcs.createisofill()

iso.levels = [-40, -30, -20, -10, 0, 10, 20, 30, 40]
#iso.levels = [-40, -30, -20, -10, 10, 20, 30, 40]  #### This does not work
iso.levels.insert(0,-1.e20)
iso.levels.append(1.e20)

iso.colormap = 'bl_to_darkred'
colors = vcs.getcolors(iso.levels,colors=range(16,240))
iso.fillareacolors = colors

x.plot(d_anom, iso)

x.png('test.png')