reduce memory usage of parallel directory traversal by using two different stacks
What version of ripgrep are you using?
ripgrep 12.1.1 -SIMD -AVX (compiled) +SIMD +AVX (runtime)
Also happens on latest master - c7730d1f3a366e42fdd497a1e0db4bf090de415c
How did you install ripgrep?
cargo install ripgrep
Also happens when building from source with cargo build --release
What operating system are you using ripgrep on?
Ubuntu 18.04
Describe your bug.
High RAM use (at around 400Mb) when searching through a large number of files - 9,489,520 files, roughly 100Gb of data.
What are the steps to reproduce the behavior?
The exact command used is rg --no-ignore AddressSanitizer
Unfortunately the corpus is very large (100Gb) and is only moderately compressible (to 20Gb or so). I could probably figure out a way to ship it if hard-pressed, but I would prefer to avoid that if reasonable.
I've profiled rg with Heaptrack to figure out what's taking up most of the memory. Turns out it's a single large vector that gets reallocated to larger and larger sizes. Here's the heaptrack profile taken on the 12.1.1 release.
Here's the backtrace for this allocation as displayed by heaptrack GUI:
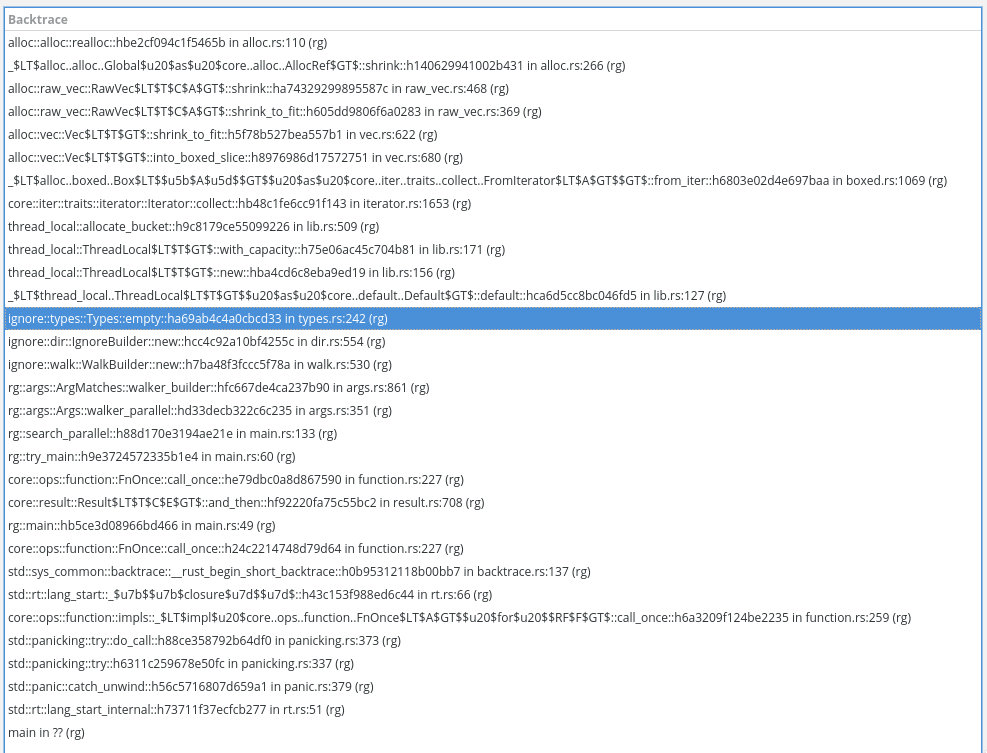
It appears that the ignore logic is responsible for these large allocations, even though I've passed the --no-ignore flag. The memory use is even higher without --no-ignore, but not by much (another 100Mb or so).
What is the actual behavior?
The peak memory use is at around 400Mb.
Output of rg --debug --no-ignore AddressSanitizer: https://gist.github.com/Shnatsel/f389152c908bbf78b5dfadbd7dec3f79
What is the expected behavior?
Memory use below 50Mb
Thanks for the report!
So I'll say that off the bat, it will be difficult for me to do anything about this without a repro. It's possible that the high memory usage is due to a specific file. So if that's the case, it might be possible for you to whittle this down by trying smaller and smaller subsets of your corpus and see if you can still observe high memory usage. If not, then yeah, I'd probably have to have a way to debug this myself.
What follows is me brainstorming.
My initial guess at this, ignoring your heap backtrace, would have simply been that one or more of your files has very long lines. And because of that and the constraint that a line must fit contiguously in memory, ripgrep expands its internal buffers to fit it. (Since ripgrep has several of these buffers in existence due to parallelism, it's possible that there are a few files with moderately long lines, and the expansions of all those buffers adds up to increased memory usage overall.) In general, this kind of thing just cannot be avoided and is a known limitation of ripgrep. It's also a problem with GNU grep. This is why, for example, GNU grep will by default replace NUL bytes with line terminators in case it trips over a binary file with no line terminators in it. In that case, the entire file would be treated as one single line, which could be quite bad.
Now, given your heap trace, I'm not sure what to think. If it is indeed related to ignores, then yeah, I would expect --no-ignore to fix it.
Some things to try:
- How does
rg -uuubehave? - How does GNU grep behave on the same data set? What is its peak memory usage?
- What happens if you pass
-ato ripgrep? And GNU grep?
Oh, also, I'm not sure how to use your heap profile. Is there a program I should be using to open it that gives me a nice visualization?
Yeah, here's the GUI that analyzes this format: https://github.com/KDE/heaptrack
heaptrack --analyze "/path/to/file.gz" works, you don't even need to ungzip it.
@Shnatsel Oh my goodness. That is spiffy! Love it. Do you mind sharing the command you used to create that profile?
heaptrack rg --no-ignore AddressSanitizer, it's that simple. By the way, it also shows a ton of short-lived allocations somewhere in colored printing even though I don't have a ton of matches.
OK, I've looked at this with heaptrack and expanded a few traces:

From what I can see, there are three distinct sources of large memory usage:
- The first, and biggest (179MB) appears to be what I speculated about above: there is a long line somewhere that is growing ripgrep's internal buffer. If that is indeed true, then it should be possible to narrow this down to the particular file. But, if it really is just a long line, then unfortunately that's just the way the cookie crumbles. The only real possible work-around here that I can think of is to occasionally contract the buffer, which in the presence of multiple threads, could theoretically lower peak memory usage if there are multiple files with long lines and they are searched using different buffers. But figuring out the best strategy for that is tricky and I'm inclined to pass on it.
- The second (142MB) appears to be a result of the parallel directory traversal eagerly collecting the paths it wants to traverse. This is somewhat related to the last memory problem you reported, which I "fixed" by switching from breadth first to depth first traversal. But it's not a truly fundamental fix. I would love to fix this, but I don't know. I don't know how to introduce back-pressure in the traversal algorithm. :-(
- The last one (46MB) is the most perplexing. It looks like a single path is using up tens of MB. Does that sound right to you for your specific data set? That can't be right, right? Neither
PathBufnorOsStringbuffers are reused in ripgrep IIRC, so I'm not really sure what could be causing that. Unless the heap trace isn't reporting a single path, but rather, "there are a whole bunch of PathBufs using lots of memory," which would be consistent with (2) above.
GNU grep only uses 125Mb at its peak:
time grep -r AddressSanitizer
60.91user 208.19system 15:22.34elapsed 29%CPU (0avgtext+0avgdata 125588maxresident)k
179260304inputs+0outputs (2major+56824minor)pagefaults 0swaps
Here's the -uuu command:
time rg -uuu AddressSanitizer
64.60user 239.45system 5:06.36elapsed 99%CPU (0avgtext+0avgdata 592932maxresident)k
195622760inputs+0outputs (57major+150679minor)pagefaults 0swaps
The command for which I posted the heaptrack profile:
time rg --no-ignore AddressSanitizer
64.48user 244.57system 5:09.16elapsed 99%CPU (0avgtext+0avgdata 524660maxresident)k
193740072inputs+0outputs (16major+137157minor)pagefaults 0swaps
Default configuration:
time rg AddressSanitizer
65.97user 245.02system 4:54.54elapsed 105%CPU (0avgtext+0avgdata 591276maxresident)k
193990288inputs+0outputs (5major+167537minor)pagefaults 0swaps
@Shnatsel In light of some observations above, what happens if you do time rg -uuu -j1 AddressSanitizer?
To find the many small allocations, go to bottom-up view and sort by the number of allocations, then select the first entry.
This is what the bottom-up list sorted by allocation count looks like for me:

If you click the first item, this is the backtrace:

termcolor frames are prominent in this backtrace.
Yeah, there will be some allocs from termcolor because the printer is writing to an in memory buffer owned by termcolor when using parallelism. I can see them in the heap viz. But whenever I try to drill down and follow the trace with the most allocs, I don't wind up in termcolor, but rather, in PathBuf crud. (And this is unfortunately to be expected, because std provides no way of amortizing allocs when dealing with file system APIs. There are lots of little hidden allocs in that area, particularly with respect to creating C strings for libc APIs. I have a WIP patch in walkdir to try to fix some of it, but it's a steep steep hill to climb.)
-j1 makes a huge difference. For a good part of the execution the memory use is just 1Mb!
The final result is even lower than GNU grep!
time rg -uuu -j1 AddressSanitizer
73.94user 256.63system 16:59.72elapsed 32%CPU (0avgtext+0avgdata 58836maxresident)k
185588456inputs+0outputs (3major+13642minor)pagefaults 0swaps
I have 4 cores, no SMT. /proc/$pid/status shows 5 threads for the rg process when running rg --no-ignore AddressSanitizer
All right. I think I'm going to have to close this at wontfix. I don't see any obvious thing to do here to fix the higher memory usage when using parallelism. One should expect using parallelism to use more memory I think. It's really a fundamental trade off in a tool like this. A reasonable response would be that parallelism should increase memory usage proportionally with a low constant. In your case, it looks to be increasing by a factor 10 instead of 4 or 5. But unfortunately, the parallel aspects of ripgrep (thinking about the recursive directory traversal) are piggish in a way that isn't a simple linear increase with the number of threads. And I don't know how to fix it, sadly.
Ah, I also have a directory structure that's very wide this time around, so that's what probably hogs all the memory. Some directories have 600,000 files in them. That's probably a contributing factor.
What is the fundamental issue with introducing backpressure? Perhaps we can figure out some kind of solution.
This is the relevant code: https://github.com/BurntSushi/ripgrep/blob/c7730d1f3a366e42fdd497a1e0db4bf090de415c/crates/ignore/src/walk.rs#L1383-L1678
The directory traverser is setup as a fixed thread pool. Each thread has a worker. Basically, what happens is that once you see a directory in a worker, you list its contents. All entries in that directory are then "sent" on a channel (implemented here as a thread safe stack). Each worker is waiting on things coming in the channel. When it pops an item off the stack, it's (roughly) either a file or a directory. If it's a file, it will execute the caller's function (which in ripgrep's case will perform the actual search, write to a buffer, etc.). If it's a directory, then it repeats the process: lists its contents and pushes every item on to the stack for the worker pool to process.
So what happens is that when you hit directories, the implementation immediately plops every single one of its entries on to the channel. And when it hits more directories, it keeps doing the same. Thus, my working theory is that it very quickly just plops the entire set of things to search on to this channel.
Previously, I was using an asynchronous channel for this. And that gave us a breadth first traversal. But now we use a stack. Both things have this particular problem.
The naive desire here would be to have a way for the stack to have a constrained size and prevent the workers from pushing more stuff on to it until the workers have completed more of the work. This is the fundamental problem that I have not figured out how to solve. More specifically, the difference between this problem and typical thread/worker formulations is that the producers and consumers are the same. So if you start constraining the stack, you aren't just constraining a producer but a consumer as well. And one invariably leads to deadlock. This is why termination is subtle and weird.
Now, I am not claiming that this is itself an unsolvable problem. I do not have enough experience with this sort of thing to be certain about it. What I mean is that I just haven't figured out how to fix it.
Ah, so even leaving the files to be searched aside for a moment, completing some work on the directories may result in more directories being discovered that we have to add to the queue. This makes constraining the size of the directory queue very problematic because completing some work may create more work that we have to add to the queue.
The file queue however doesn't suffer from this problem. So it should be possible to constrain the queue of those at least, and switch from discovering new files to searching the files that have been already discovered when the queue exceeds a certain size threshold. That should alleviate at least part of the problem.
Ah, so even leaving the files to be searched aside for a moment, completing some work on the directories may result in more directories being discovered that we have to add to the queue. This makes constraining the size of the directory queue very problematic because completing some work may create more work that we have to add to the queue.
Exactly.
The file queue however doesn't suffer from this problem. So it should be possible to constrain the queue of those at least, and switch from discovering new files to searching the files that have been already discovered when the queue exceeds a certain size threshold. That should alleviate at least part of the problem.
This is an interesting idea. I can't immediately knock it down, so I'll re-open this, rename it and tag it with help wanted to see if anyone wants to take a crack at it. In theory, it should be a fairly isolated change. But it might be a tricky/subtle one.
Hi both! I've had a go at implementing the proposed change here https://github.com/edoardopirovano/ripgrep/tree/double-stack 🙂
@Shnatsel If you've still got the data that you encountered the memory issues with, would you be able to try it out with my branch and see if that reduces your memory consumption? Locally, I can't seem to get much difference, but it's possible that I just don't have the right file/directory structure to cause issues (I tried 1,000 directories with 10,000 files each but observed no difference with both peaking around 41MB with 16 threads)
~~I have 10 directories with a million files each.~~ I'll try the branch, thanks!
10 or so. Here's the exact output: https://gist.github.com/Shnatsel/f389152c908bbf78b5dfadbd7dec3f79
Okay, so the branch has actually increased memory usage slightly: 552 Mb before, 586 Mb after.
Also, I was not entirely correct: I have 10 directories, each of which contains 2 subdirectories, and a million files is split among those subdirectories, with the ratio being something like 900,000 in one and 100,000 in the other. The files are text, no more than 10Kb each.