REPL on vscode built-in debug console
I was thinking if it might be a good idea to explore an option to allow the output.calva-repl window to be output into the vscode built-in debug console.
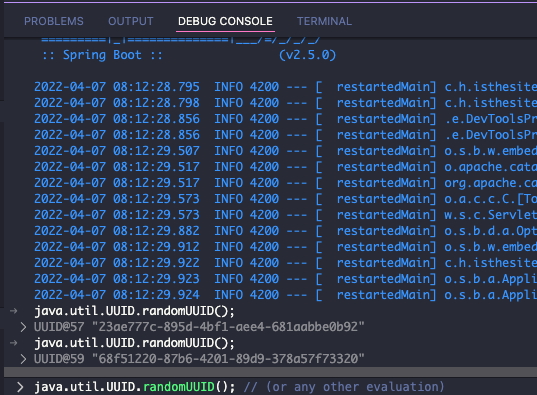
The vscode built-in debug window has also a field to enter and evaluate expressions (when a debug session is started) This would be a chance to integrate this extension into the native elements of vscode :) And potentially save some space on the screen.
The redhat's java extension support has a similar feature related to what I am proposing.
When the option "java.debug.settings.console": "internalConsole" is set, the application output is redirected into the debug console and from there it's possible to evaluate expressions when the thread is suspended.
Thanks for this great clojure support btw. Cheers!
Thanks for the feature request!
Last time I checked the debug console did not support input outside a debug session. And I couldn't make it use Clojure syntax haghlighting. These can have changed of course. You are super welcome to do some research on this. The Java extensions use of this is a very nice find!
@hvitoi I'm not sure if you're aware, but you can currently evaluate Clojure code while the Calva debugger is suspended as you usually would from a source file or from the repl window. This video shows that in action. I find that method more flexible than using the debug window input, since we can use source files directly and easily evaluate multi-line Clojure forms (I'm not sure if multi-line forms are supported in the debug window input field) which are syntax highlighted and formatted.
@bpringe I think the idea is to utilize the debug console as an option for where the output/repl window could be, versus as a regular text document editor tab alongside the code. The other points about multiline, syntax hilight etc, I'm not sure about still. And of course, if the debug console cannot be used whilst outside of debug mode, then it's not very feasible anyways.
@bpringe I think the idea is to utilize the debug console as an option for where the output/repl window could be, versus as a regular text document editor tab alongside the code. The other points about multiline, syntax hilight etc, I'm not sure about still. And of course, if the debug console cannot be used whilst outside of debug mode, then it's not very feasible anyways.