BabylonNative
 BabylonNative copied to clipboard
Babylon Native uses a lot more memory than Babylon.js when loading glbs
For this 16mb model: https://raw.githubusercontent.com/microsoft/experimental-pcf-control-assets/master/bird_of_paradise_blue.glb
Loading and rendering it with Babylon.js (within a WKWebView (WebKit)) uses about 180mb of main memory. Loading and rendering it within Babylon Native (within an iOS React Native app) uses about 500mb of main memory.
This seems like a substantial difference and can create a lot of memory pressure on memory constrained mobile devices. We should try to understand why Babylon Native seems to be so much more memory intensive.
The memory footprint numbers (180Mb and 500Mb) are delta between app running before and after loading the glb or is it the total memory footprint of the app after loading glb? I'd like to know how much memory React layer is using compared to a webview.
They are both deltas. In the WebView case, the ReactJS app was already running, and then it loads BJS + the model. In the Babylon Native case, the React Native app was already running, and then it loads BRN + the model. So in both cases I was just looking at the delta in overall main memory usage.
For whatever reason, VS memory profiling tools aren't working on the Babylon Native Playground app (snapshots spin forever and never become inspectable), but by futzing with refresh it looks like, on Windows at least, the overwhelming majority of the memory consumption is in bgfx.
All of the following results were gathered by changing the Playground behavior on press of the R key from RefreshBabylon to Uninitialize, then commenting out various parts of uninitialization and observing changes in the memory footprint. In "Release With Debug Info" on Win32 with the provided GLB, the process tops out around 540 Mb during loading before dropping, first quickly and then gradually, to a stable state around 460 Mb. When we comment out the lines of Uninitialize which reset Graphics, leaving that intact while destroying InputBuffer and Runtime, then on Uninitialize we see a drop in memory footprint to about 360 Mb. On the other hand, if we comment out the lines destroying InputBuffer and Runtime such that we keep those and only destroy Graphics, Unitialize causes a three-step drop over a few seconds down to a total memory footprint of 117 Mb. Diving deeper, if we uncomment everything in Uninitialize and instead comment out bgfx::shutdown in GraphicsImpl.cpp, total memory footprint falls only to 359 Mb and stays there. This strongly indicates that, of our stable (as opposed to peak) total memory consumption on Win32, well over 70% is in bgfx.
Switching over to debug in order to inspect the results of bgfx::getStats, we see the following:
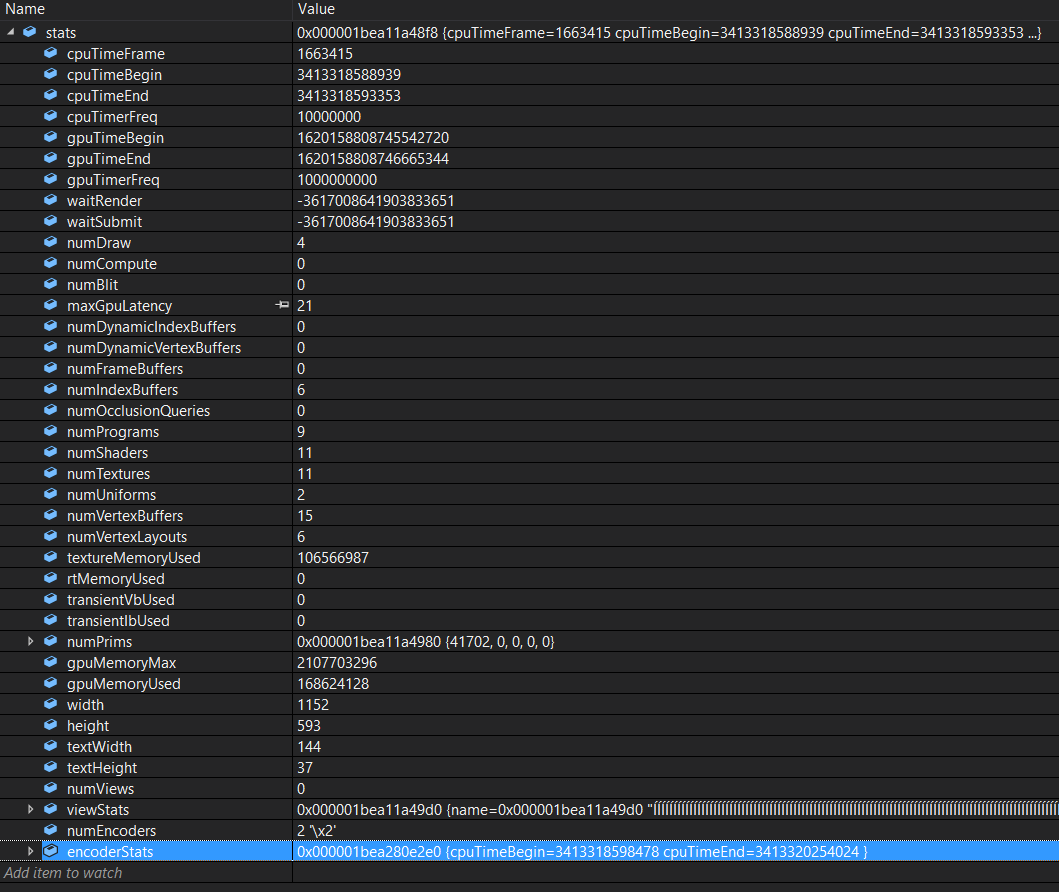
As shown here, somewhere north of a quarter of bgfx's memory consumption is ascribed to texture memory; though not trivial, this is smaller than I would have expected, but corroborates my earlier (unverified) observation that turning off mipmaps didn't seem to have a meaningful effect on memory footprint. With all this in mind, my (highly speculative) guess at this point is that the following factors are involved:
- bgfx is reserving large amounts of memory upfront to avoid allocating during its operations, possibly totaling 250 Mb or more.
- bgfx is keeping CPU copies of all texture memory, perhaps in preparation for device loss.
- Mips likely do show up in texture memory, but in total all mips should amount to well less than half of the texture memory, which itself is well less than half of the total bgfx memory footprint for this model.
With this in mind, I recommend the following next steps in the investigation:
- Repeat the experiments described above with other models of interest -- and on other platforms -- in order to gain a clearer understanding of what the flat cost of bgfx is and what the additive cost is given additional texture, geometry, etc.
- Look through the bgfx implementation to find where the texture memory is being kept and, if it's true that uncompressed textures are being held in memory, try to find a way to dispose of them.
- Look through the bgfx build system at the available configuration variables. I strongly suspect that there is a configuration variable which controls the amount of memory bgfx reserves for itself. If that exists, more memory-constrained apps should be able to lower that from the default in order to reduce the flat memory cost associated with using bgfx at all.
@ryantrem , the PR with memory optimizations is already in master. Can you check if this solves the issues you guys were having?