Likelihood of different stellar phases
It would be good to be able to get the likelihood of stellar phases (AGB stars in particular) using cuts in the outputs, i.e. selections in the HR-Diagram space. This could then be represented as a percentage (likelihood) in the output of the BEAST.
This would be great. Might be a great addition to catalog papers at a minimum (issue #333). But also very useful for science papers. Could also make computations for other physical parameters. Probabilities of low and high AV stars. Low and high Rv stars. Young and Old stars.
One question to resolve, is this something that would be done as part of the fitting? Or a post processing step? If the former, then the full nD likelihood function is available. If the latter, then only the n samples of the likelihood could be used (e.g., 500).
Results from Brick 9 from the BEAST results from PHAT. Next i'll select regions for different phases of stellar evolution.
| Lum_best v Teff_best | Age_best v Mass_best |
|---|---|
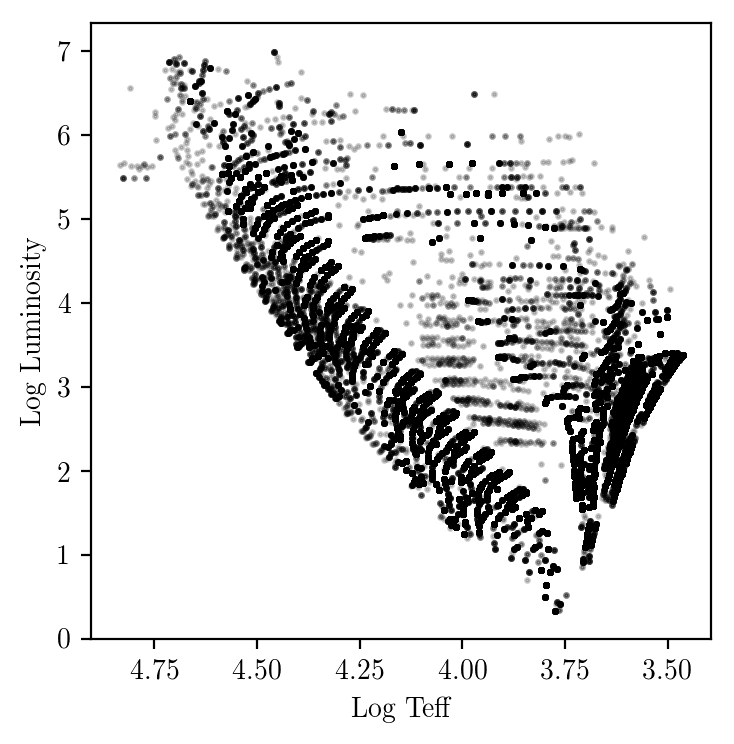 |
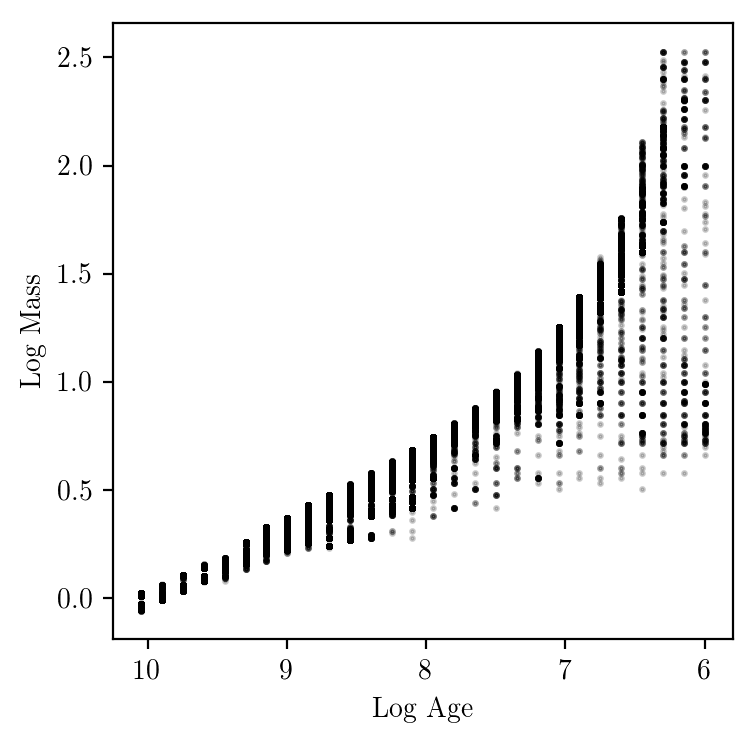 |
You could also great density plots from the physicsmodel grid and the prior weights. This would provide a nice visualization of the allowed physical range. The PHAT results will give what is possible at the sensitivity of the that survey. Making such a visualization might be really nice to have for other reasons (e.g., impact of different choices on stellar priors).
One question to resolve, is this something that would be done as part of the fitting? Or a post processing step? If the former, then the full nD likelihood function is available. If the latter, then only the n samples of the likelihood could be used (e.g., 500).
If we calculate after the fitting, we won't have accurate probabilities for the lower-likelihood star types, because we presumably won't have any saved lnPs (or very few) that even overlap them. Also, depending on how we select the lnPs, if we miss some high probability ones, we could have some catastrophically mis-identified star types (see plot here).
I see three disadvantages to doing this during fitting:
- We need to decide ASAP what the criteria are for every type we might possibly care about. And those criteria might even change between galaxies (for instance, the minimum A_V for extinction curve candidates).
- It'll take a lot longer to calculate for the whole grid than for 500 (or even 1000 or 2000) sampled points.
- It would take a bit of effort to make it work with subgrids.
Another thing we could do, which @jduval82 suggested, is save the 2D PDFs, in addition to the 1D PDFs. This would also solve the problem, as long as selecting stellar types only required cuts in two parameters.