Expose total bus capacity as metric
Enhancement Description
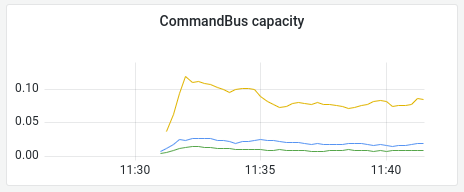
Exposing the capacity of a bus will allow users to better monitor the capacity of the application,
Current Behaviour
The capacity metrics expose the percentage of time the thread pool was busy - reflecting the amount of busy threads, up to the max thread pool size. When monitoring this, the maximum value depends on the number of instances, which can be increased dynamically. This is very easy to do wrong.
Wanted Behaviour
Expose a commandBus_capacity_total and queryBus_capacity_total, containing the thread pool sizes for these busses.
This will allow a prometheus query resulting in a percentual capacity, like so:
 sum by(app) (commandBus_capacity) / sum by(app) (commandBus_capacity_total)
Possible Workarounds
Build it yourself, like this:
public class CapacityMetricProvider {

    public CapacityMetricProvider(MeterRegistry meterRegistry,
                                  Long queryThreads,
                                  Long commandThreads) {
        meterRegistry.gauge("commandBus_capacity_total", commandThreads);
        meterRegistry.gauge("queryBus_capacity_total", queryThreads);
    }
}
@Configuration
public class MetricsConfig {
    @Bean
    public CapacityMetricProvider capacityMetricProvider(MeterRegistry meterRegistry,
                                                         @Value("${axon.axonserver.query-threads:10}") Long queryThreads,
                                                         @Value("${axon.axonserver.command-threads:10}") Long commandThreads) {
        return new CapacityMetricProvider(meterRegistry, queryThreads, commandThreads);
    }
}
I like the idea to expose commandThreads and queryThreads over the Metrics API! These represent the max size of the thread pool for command/query handling and it will make the Capacity graph look much better (the y-axis can show percentages being used, and not just the number of threads being used)
It would be nice to trigger this Gauage and increment or decrement the value on every application restart (or thread pools size being changed)