Eddy identification add map
I successfully downloaded SLA data in AVISO, and the eddy was detected, but I would like to ask how to correct the longitude of the X axis, and how to add the world map to my map.
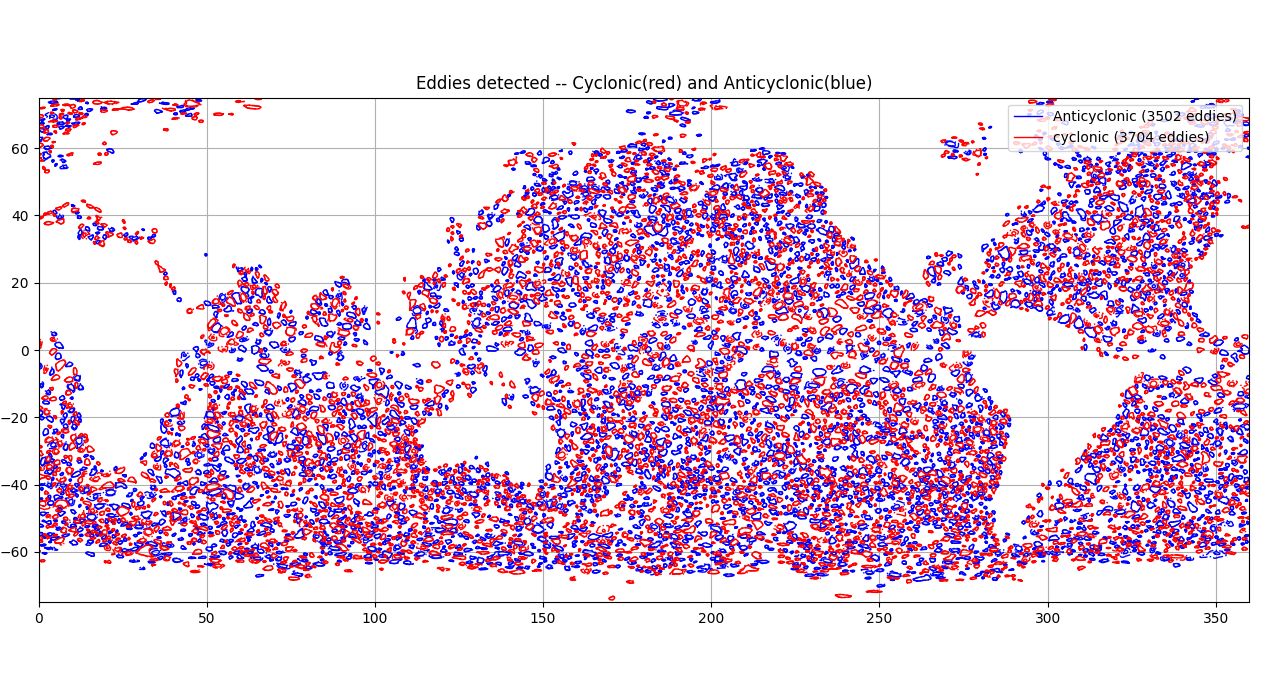
Hi, I don't understand what you mean by correct the longitude? To draw coastline use library compatible with matplotlib like cartopy.
I need to correct the X axis to west longitude (0W to 180W) and east longitude (0E to 180E) instead of 0 to 360 degrees, or is the longitude in the data just 0~360 degrees?
I have corrected it. Some areas are consistent with the coastline I added, while others are not.
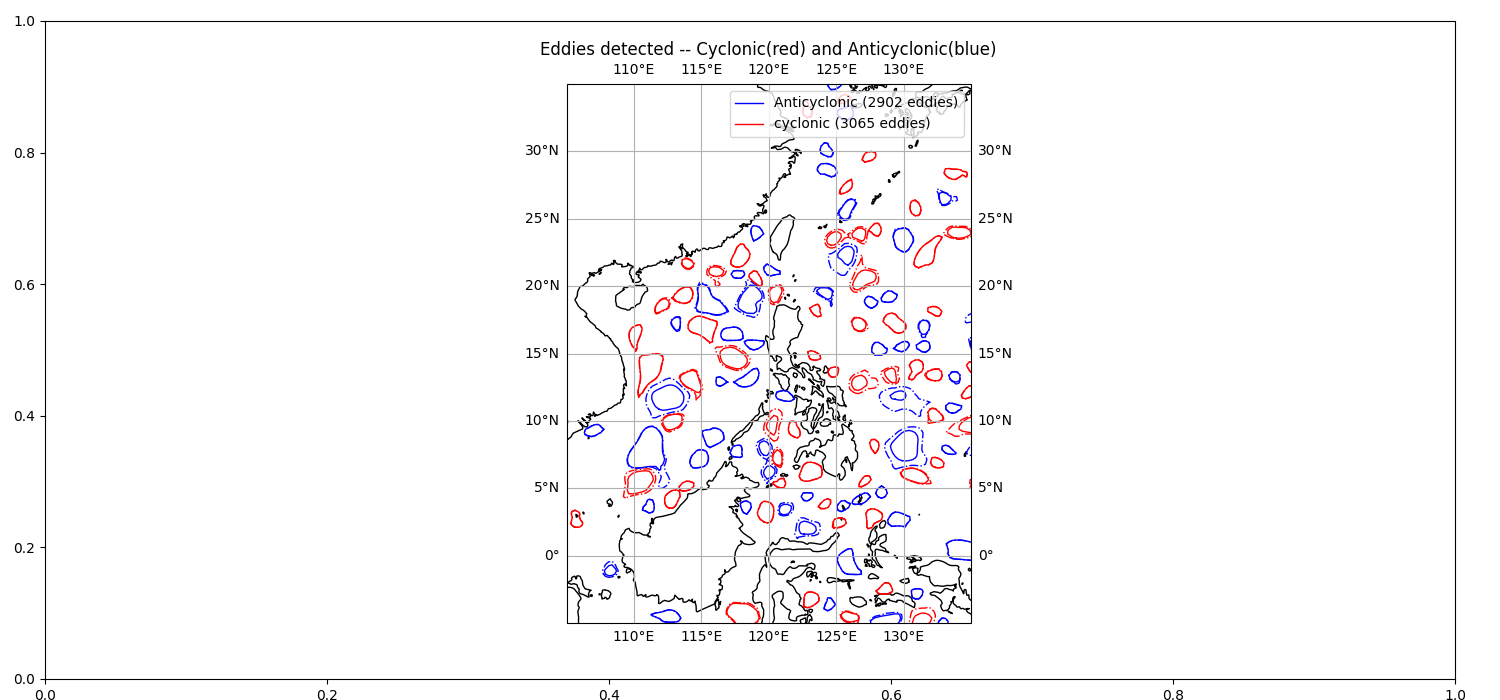
All longitude eddy centers are stored between [0;360[ contour are normalized around eddy center (contour longitude could be less than 0 or greater than 360). When eddies are detected there is no check with land mask or coastline. If height input grid have valid value on land, eddy could be detected in those area...
@hanyangliu1002 Hi, are you Taiwanese? I have some questions, can you help me?