Running with my own data is not displayed with results
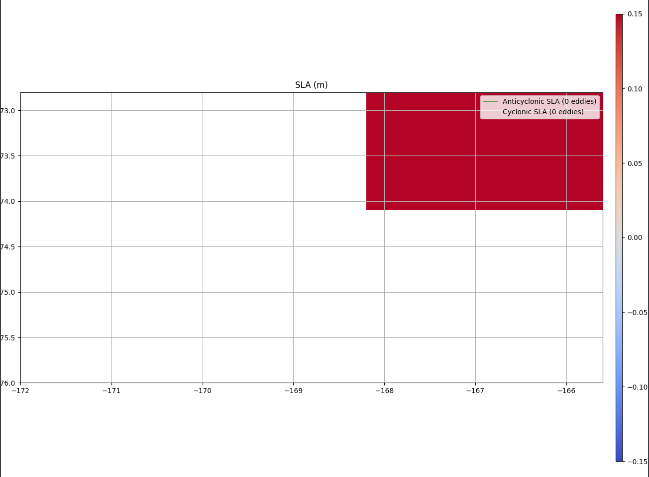
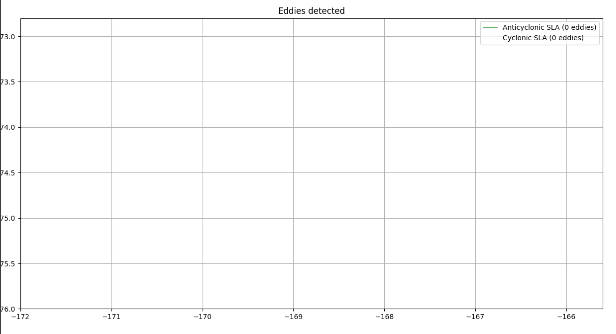
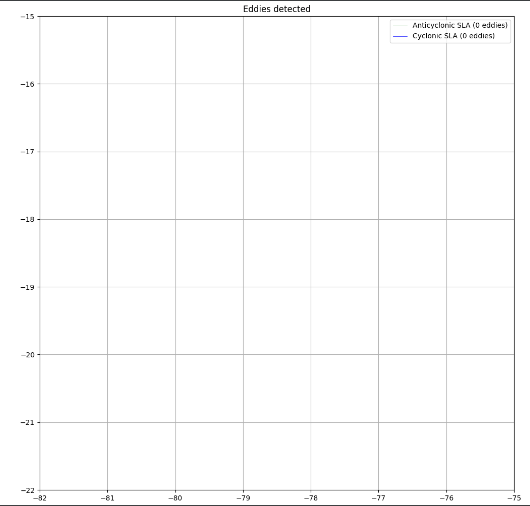
I want to ask you this question,When I run the modified pet_sla_and_adt.py with the nc file I generated, no results are displayed, as shown in the following two pictures and pet_sla.txt,Please help me see what the problem is!thank you!
 pet_sla.txt
When I use all the data, the result a_sla and the result of SLA picture are shown in the following figure, when I generate the SLA picture ,I modify diaplay parametersstill to "m = g.display(ax, "sla_raw")" remove vmin and vmax .The remaining result part is the same as above, without a demonstration of the eddy curve.
yes,I removed this options .I have another question,Whether this result error is related to the data order of magnitude, because my SLA is simulated.
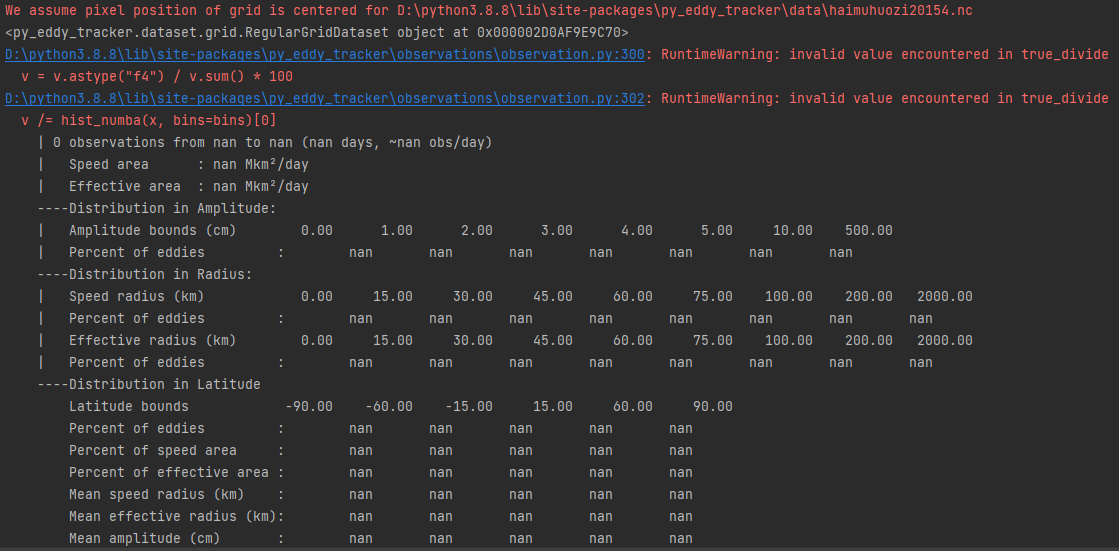
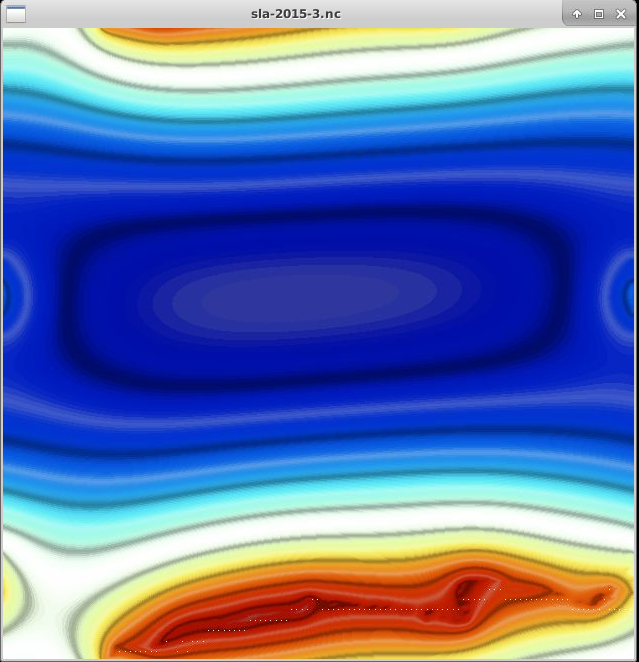
when I use another real download data from HYCOM,This error occurred like: No extrema found in contour of 4pixels in level 0.634000,the result like this picture.I don't know why this.
No extrema found in contour of 4pixels this warning is catch when all pixel in contour have same value
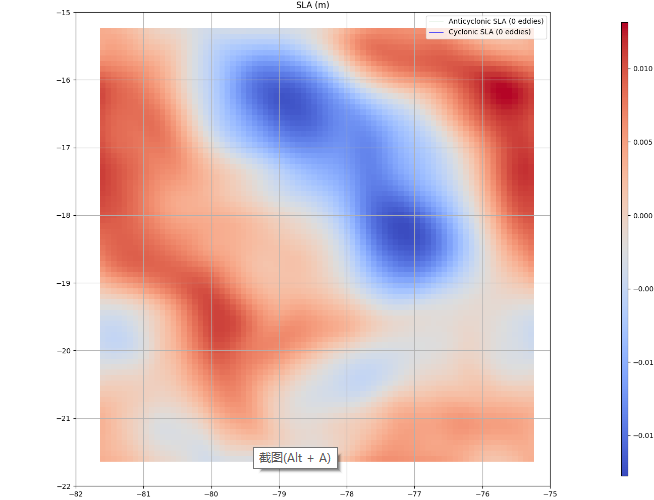
When i do a quick ncview on your sla file, i didn't see eddies
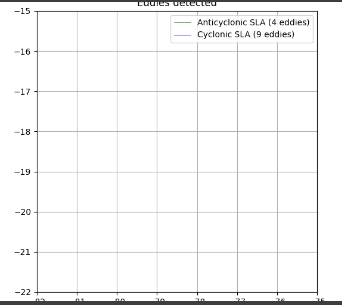
but why the top of picture show 4 Anticyclonic eddies ,9 cyclonic eddies?
but why the top of picture show 4 Anticyclonic eddies ,9 cyclonic eddies?
Maybe you don't look at the right place, unzoom your plot or/and look at eddies coordinates