Plotting with just one color
Hello,
Is there a way to do a plot which, instead of using pseudocolor on a field, just plots with a single fixed color? In my case this would be useful when given the result of a pipeline which does thresholds, where the only information I want to convey is which subset of the elements passed the threshold.
Thank you!
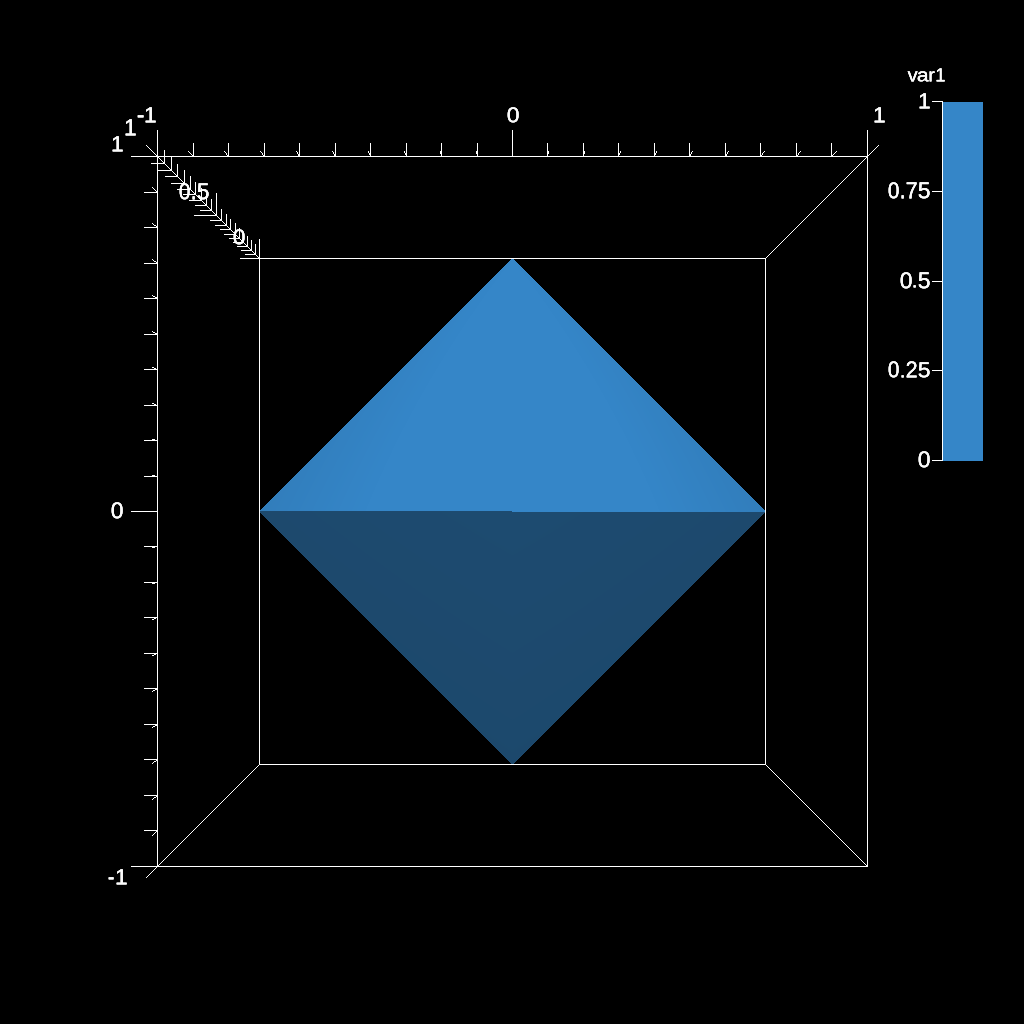
@ibaned the easiest way to do this is to create a custom color table with a single color, here is an example:
-
  action: "add_scenes"
  scenes:
    s1:
      plots:
        p1:
          type: "pseudocolor"
          field: "var1"
          color_table:
            control_points:
              -
                type: "rgb"
                position: 0
                color: [0.207843137254902, 0.525490196078431, 0.784313725490196]
      image_name: "out_ascent_render_tets"
Thanks @cyrush ! That seems like a good stopgap solution, and I can confirm that it works! Would you be open to developing a new plot type in Ascent that does this so the user interface is nicer, kindof like the sketch below?
-
  action: "add_scenes"
  scenes:
    s1:
      plots:
        p1:
          type: "onecolor"
          pipeline: my_thresholded_pipeline
          color: [0.207843137254902, 0.525490196078431, 0.784313725490196]
      image_name: "out_ascent_render_tets"
This plot type would also omit a legend
Yes, we can work towards that.
I want to ponder the naming a bit more.
There are also cases were we want discrete color maps (use case: color domains of a dataset) that might have some overlap with this use case.