DgrmJS
 DgrmJS copied to clipboard
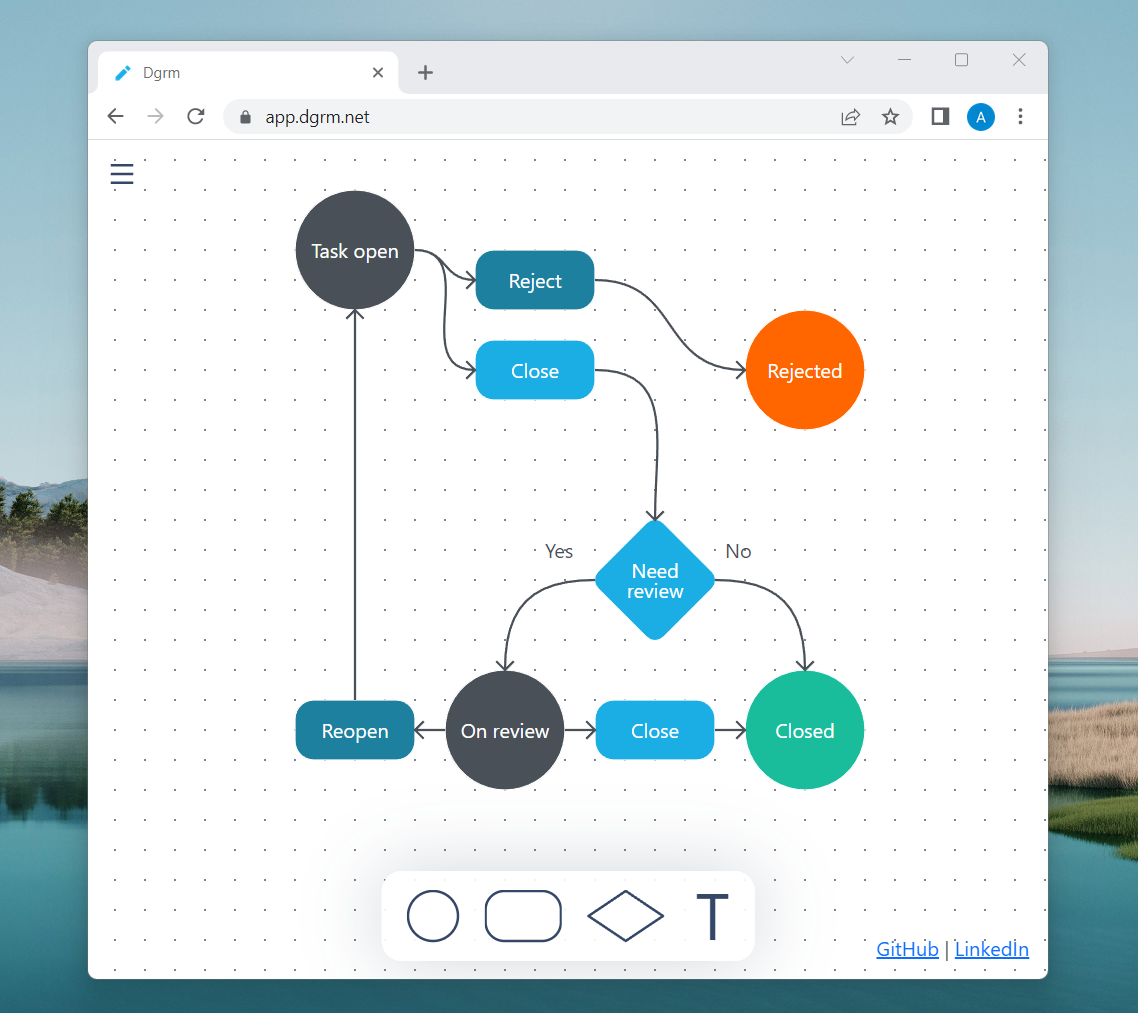
Dgrm.net - flowchart editor. Works on desktop, phone and tablet. Has no dependency. Pure JavaScript.
DgrmJS
DgrmJS is a JavaScript library for creating SVG flow diagram editors.
The main goal of the library is to set up workflows in BPM (Business Process Management) systems.
- Works on desktop and mobile
- Has no dependency
- 3.5 KB gzipped
Demo: diagram editor dgrm.net.
Articles:
JavaScript SVG diagram editor 6.5 times smaller than Bootstrap
JavaScript diagram editor that renders diagrams from PNG images (open source)
JavaScript text editor for SVG
Main idea
- Allow developers to use standard SVG objects and features to declaratively create shapes that will be used in the diagram.
To create shape, developers should add special data- attributes to standard SVG markup. So any svg images can be used as a shape in a diagram. - DgrmJS dispatch events, like ‘shape is selected’ or ‘shape is connecting to another shape’.
Developers can use these events to implement their own logic, for example, make a JSON description of the workflow.
How to use
See a minimalistic example - GitHub repository: DgrmJS Example.
Install
From npm:
npm i dgrm
Simple shape
This is a circle shape:
<svg id="diagram" style="touch-action: none;">
	<defs>
		<!-- shape template 'circle' -->
		<g data-templ="circle">
			<circle ... />
			<!-- inner named element,
			we can use 'data-key' value as a key
			in shapeAdd(...) method -->
			<text data-key="text"></text>
		</g>
	</defs>
	<g data-key="canvas"></g>
</svg>
<script type="module">
	import { svgDiagramCreate } from './diagram/svg-presenter/svg-diagram-factory.js';

	const diagram = svgDiagramCreate(document.getElementById('diagram'))

	// add shape to canvas
	diagram.shapeAdd({
		// template name
		// (value of the 'data-templ' attribute)
		templateKey: 'circle',
		position: { x: 120, y: 120 },
		props: {
			// inner svg element with 'data-key=text'
			// will get 'textContent' value 'Title'
			text: { textContent: 'Title' }
		}
	});
</script>
diagram.shapeAdd method add to canvas shape:
- created by template with name "circle"
- to position at point 120, 120
- props set
textContentof the inner element withdata-key="text"to "Title"
This way you can set any attribute of any shape object.
Result is a draggable circle with "Title" text:

Add "out connectors" to shape
"Out connector" is an element from which you can draw out a connecting line.
Add data-connect="out" to mark element as a out connector:
<g data-templ="circle">
    <circle ... />
    <text data-key="text"></text>

    <!--
        out connector
        data-connect-point - point into shape where connector line starts
        data-connect-dir - direction of connector line
    -->
    <circle
        data-connect="out"
        data-connect-point="60,0"
        data-connect-dir="right" ...>
    </circle>
</g>

Add "in connectors" to shape
"In connector" is an element where you can connect a connection line to a shape.
<g data-templ="circle">
    <circle ... />
    <text data-key="text"></text>

    <!--
        out connector
        data-connect-point - point into shape where connector line starts
        data-connect-dir - direction of connector line
    -->
    <circle
        data-connect="out"
        data-connect-point="60,0"
        data-connect-dir="right" ...>
    </circle>

    <!--
        in connector
    -->
    <circle
        data-connect="in"
        data-connect-point="-60,0"
        data-connect-dir="left" ...>
    </circle>
</g>

Events
In this example:
- we subscribe to the
selectevent - update title of the selected shape
<svg id="diagram" style="touch-action: none;">
    <defs>
        <!-- shape template 'circle' -->
        <g data-templ="circle">
            <circle ... />
            <!-- inner named element,
                we can use 'data-key' value as a key
                in shapeAdd(...) method -->
            <text data-key="text"></text>

            <!-- connectors -->
            <circle data-connect="out" ...></circle>
            <circle data-connect="in" ...></circle>
        </g>
    </defs>
    <g data-key="canvas"></g>
</svg>
<script type="module">
    import { svgDiagramCreate } from './diagram/svg-presenter/svg-diagram-factory.js';

    const diagram = svgDiagramCreate(document.getElementById('diagram'))
        // subscribe to 'select' event
        .on('select', evt => {

            // update selected shape
            evt.detail.target.update({
                props: {
                    text: { textContent: 'New title' }
                }
            });

        });

    // add shape to canvas
    diagram.shapeAdd({
        templateKey: 'circle',
        position: { x: 120, y: 120 },
        props: {
            text: { textContent: 'Title' }
        }
    });
</script>

Documentation
Soon
License
Diagram Engine (src/diagram folder)
MIT License
src/diagram folder contains a diagram engine that can be used independently of other project files.
This diagram engine contains all main features (all you need to implement diagram editor in your project):
- creating shapes with svg templates
- drag'n'drop
- connection of shapes
- diagram events
Source code in src/diagram folder is under the MIT License.
Diagram Extensions (src/diagram-extensions folder)
Commercial License
src/diagram-extensions folder contains additional features, like:
- export/import to/from png/svg
- text editor
- shape editor panel
- and other
Source code in src/diagram-extensions folder is under the Commercial License.
Contact with me for details.
App (src/app folder)
Commercial License
src/app folder contains diagram builder dgrm.net.
Source code in src/app folder is under the Commercial License.
Contact with me for details.
Metadata
Owner
Metadata
Dgrm.net - flowchart editor. Works on desktop, phone and tablet. Has no dependency. Pure JavaScript.