datomic-graph-viz
 datomic-graph-viz copied to clipboard
Visualize a datomic database as a graph.
datomic-graph-viz is a tool for visualizing Datomic data as an interactive explorable graph. Currently only for Datomic Pro.
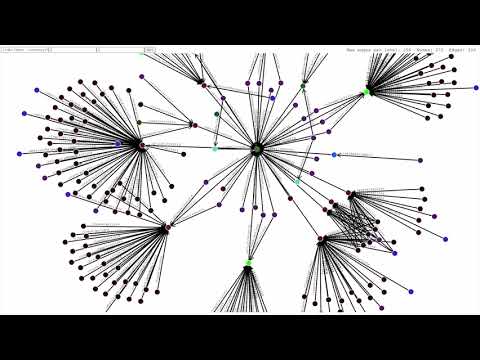
Demo screencast
Rationale
In Datomic, the schema defines the attributes in the database, but not how the data is structured. Structure is intentionally not constrained in Datomic, which gives it great structural flexibility. This is one of its really strong features in my opinion. But, the lack of a structural schema can make it difficult to understand and build a mental model of the data, especially if you're new to the db or to Datomic in general. The only option is to explore the data directly, and this tool is one way to do exactly that, using a visual interactive graph.
Getting started
Prerequisites:
With the mbrainz sample database
To explore the mbrainz sample database yourself, download and start the transactor with:
bb mbrainz-demo-transactor
When the transactor is running, run this in another terminal:
bb mbrainz-demo
And you're off!
With your own Datomic database
Depending on your storage service, you might need to add a driver dependency. See JDBC Drivers.
To run against your own Datomic database, simply run
bb start <your-datomic-connection-string>
If your browser does not open on it's own, use the provided link (http://localhost:1234 by default).
Available options to bb start are:
--conn-str             the datomic connection string to use, can be given as a positional argument
--port                 the port to the frontend is served on, default: 1234
--max-edges-per-level  the maximum number of edges fetched per level, default: 100
Usage
Mouse actions
You can drag nodes around, and grab the background to drag the whole graph around.
Double clicking a node navigates to that node. This fetches a new graph with that entity as the root node.
Form input
The eid (or lookup-ref) input sets the root node of the graph. This is automatically set when navigating with double clicks. Leave it empty to get a random entity, which is what happens on the first page load. (The random selection excludes entities without any refs to or from it).
The ancestor and descendant inputs decide how many levels of nodes are fetched in their respective directions. Limit these to control which nodes you're interested in seeing. Note that ancestors of descendants aren't fetched, and neither are descendants of ancestors. Navigate to these nodes to see all their ancestors and descendants.
Visuals
Nodes are colored using a hash of their set of attributes. This means that nodes with the same attributes have the same color, so nodes can be visually grouped by what data they contain. Note that due to this hash-based color selection, color-proximity does not indicate similar data. Two very similar nodes can end up with colors that are completely different. Likewise, completely different nodes can have very similar colors, and may even collide with exactly the same color, if unlucky.
JDBC Drivers
Currently, drivers for sqlite and postgres are included by default. If you need a different driver, add an alias to deps.edn with the dependency using the same name for the alias as in the Datomic connection string.
bb start will find the jdbc driver name from the connection string and include that alias when starting the server.
For example, with the mbrainz demo connection string "datomic:sql://mbrainz?jdbc:sqlite:storage/sqlite.db", the name is the part following jdbc:, so the alias used is sqlite in this case.