Memory leak during animation (crash on low-end devices)
With the following sample app and the attached flare animation asset, the memory consumption increases continuously while the animation is running. For older devices like an iPhone 6plus, this will lead to the app crashing due to out-of-memory issue.
In the sample code below, it will not leak (not crashing anymore) if I change widthFactor and heightFactor to 1.0. With other animation, I observed that the breaking point is different, which makes me think that it's dependent on the actual size of the animation in the asset...
Anyone has an idea why this might be happening?
Animation asset animation.flr.zip
Sample
import 'package:flare_flutter/flare_actor.dart';
import 'package:flutter/material.dart';

void main() => runApp(MyApp());

class MyApp extends StatelessWidget {
  @override
  Widget build(BuildContext context) {
    return MaterialApp(
      home: SampleWidget(),
    );
  }
}

class SampleWidget extends StatelessWidget {
  @override
  Widget build(BuildContext context) => Scaffold(
        backgroundColor: Colors.green,
        body: Center(
          child: FractionallySizedBox(
            widthFactor: 1.1,
            heightFactor: 1.1,
            child: FlareActor(
              "assets/animation.flr",
              animation: "Loader",
            ),
          ),
        ),
      );
}
Package's version
  flare_dart:
    dependency: transitive
    description:
      name: flare_dart
      url: "https://pub.dartlang.org"
    source: hosted
    version: "1.4.1"
  flare_flutter:
    dependency: "direct main"
    description:
      name: flare_flutter
      url: "https://pub.dartlang.org"
    source: hosted
    version: "1.5.1"
Flutter doctor
Flutter (Channel unknown, v1.5.4-hotfix.2, on Mac OS X 10.14.4 18E226, locale en-NL)
Thanks for reporting this! I'm looking into it. How quickly do you start seeing memory leakage? Have you noticed if it's related to the length/duration of an animation?
The fact that the different dimensions affects it makes me suspect it's an issue Flare is exposing in the Flutter framework. We don't manually cache any of the shapes to images (although we are experimenting this in development branches).
I'll do some investigation myself and report back...
I noticed that the "Loader" animation from your example code isn't in the attached Flare file. I do see the ones listed below. Is there one in particular that's giving you problems, or is it all of them?
press bridge
searching complete
push success
searching bridge
searching light
light up to date
I've set up a simple example with each of the animations I listed above and tested painting them at different dimensions. I haven't been able to discern anything fishy yet. I let each of the looping ones run for ten minutes and did see a small memory increase from the Apple Instruments. From the Observatory, memory usage was steady (no change beyond the boundaries of each of the old/new generations).
Could you double check that the right animations got attached?
The fact that changing the rendering dimensions affects this makes me highly suspicious that there's something deeper going on here.
Quick update: I've let the looping animation "press bridge" run (at 2x scale) for an hour and thirty minutes. The app was fluctuating between 38 and 40 MB when I left. It seems to still be in the same range, still looping and now reports between 39 and 40 MB.
@luigi-rosso, thanks for looking into it. It seems I attached the wrong for file (although the one attached also showed the issue in our app). I updated the attachment in the description of the issue. Now, you should be able to use 'Loader' animation.
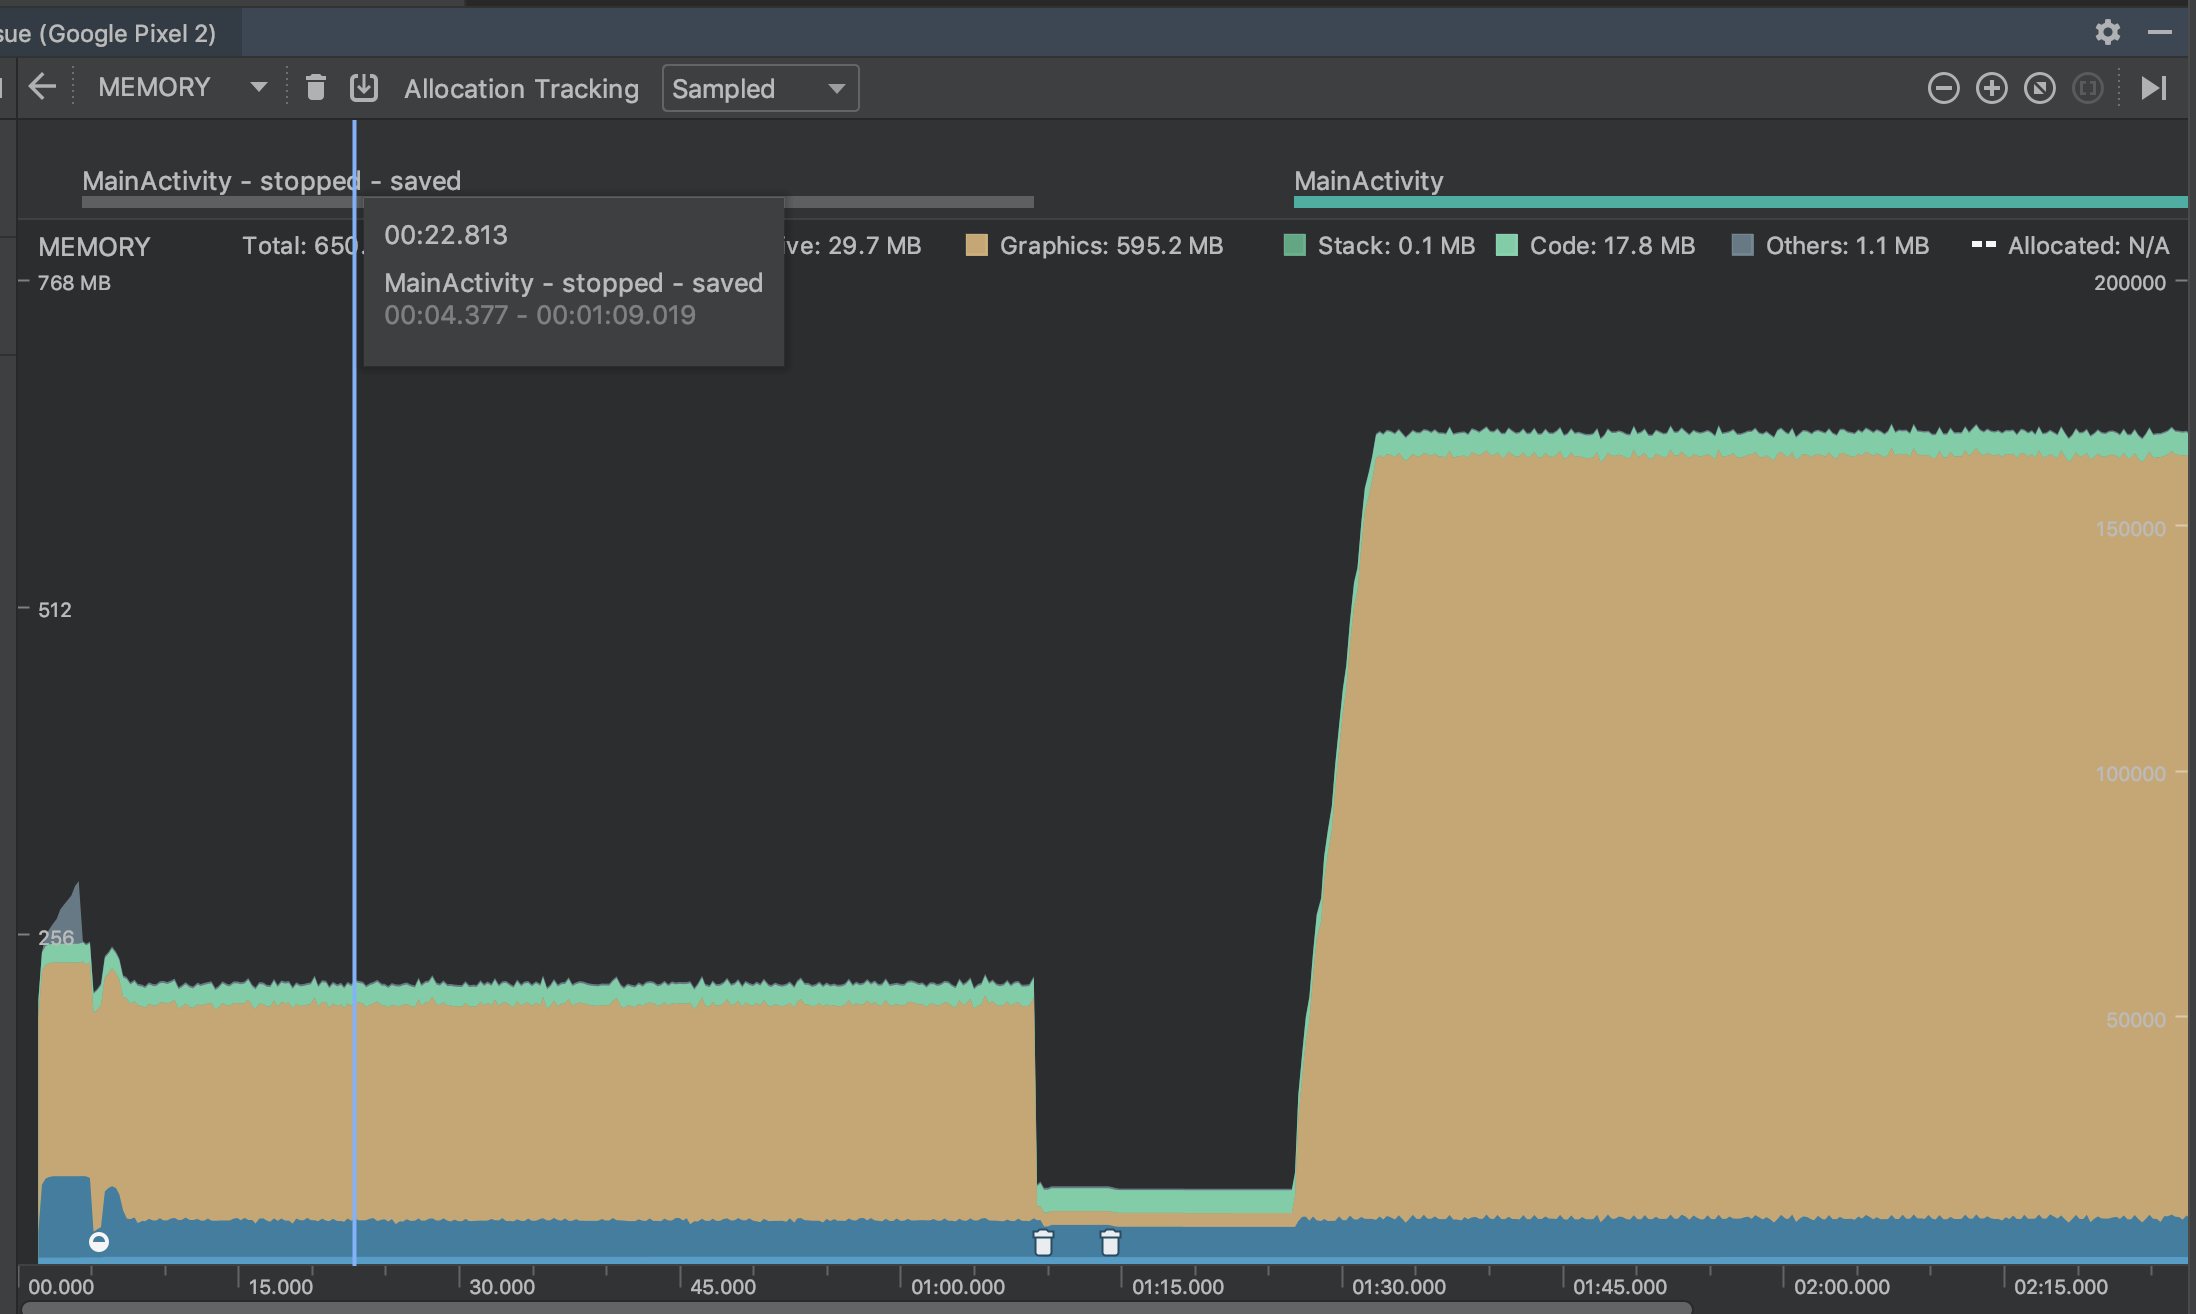
I also tested on some other devices and I could reproduce it with a Pixel 2. This is the respective memory profile:
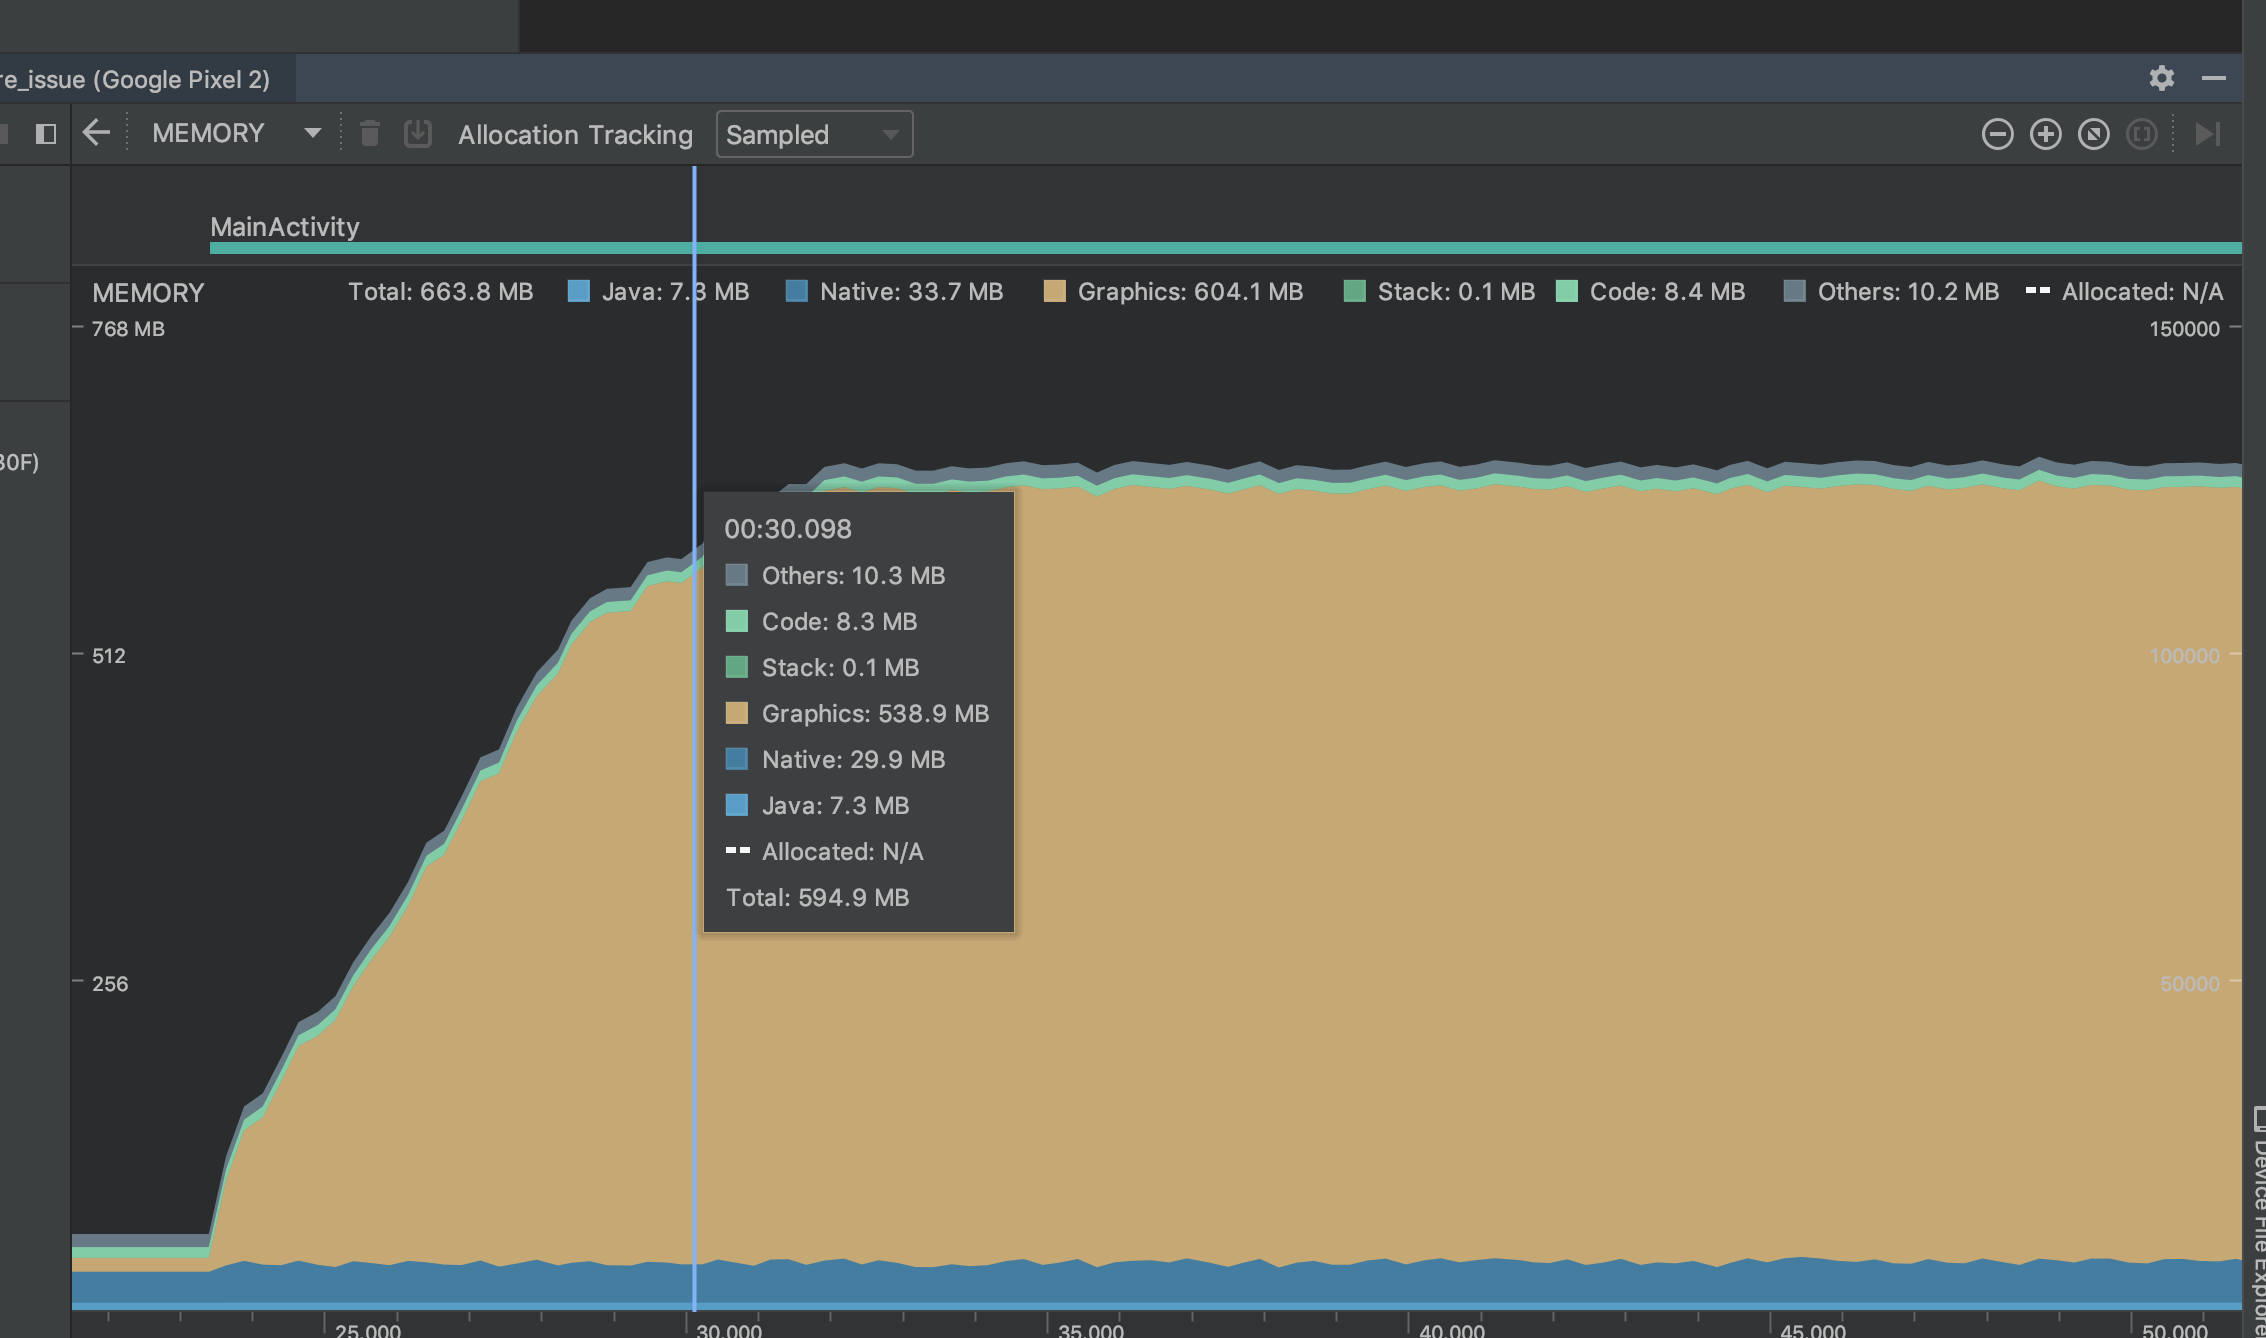
In this case it can be seen what happens when the app is in background (~60 MB) and then when it's opened. The memory consumption increases continuously until it hits some sort to boundary (~600 MB). For this device it did not crash, but the memory increase is there. In the case of iPhone 6plus the memory profile shows the same behaviour, but the app crashes. To make sure this issues reproduces, it might be good to increase the size factors to 3.0:
         FractionallySizedBox(
            widthFactor: 3.0,
            heightFactor: 3.0,
            child: FlareActor(
              "assets/animation.flr",
              animation: "Loader",
            ),
          ),
On Samsung J7 or and iPhone 7 I don't see this issue.
Your graph looks exactly like another issue...we've been working with the Skia team to track a similar issue we have in Flare (the online editor uses a web assembled version of Skia under the hood). It only manifests when you zoom in, which is effectively the same as scaling the width/height factor. Really curious if this is exposing the same issue.
If it's the same issue, it may not be a leak, but rather something Skia does internally. Take a look at this video: https://drive.google.com/file/d/1SkgcnzVQf4XnlaulXfKfzpWQoYvkd7SC/view?usp=sharing
You'll notice that the graphics cache usage starts at 14.35 MB. Then when I zoom the view in it quickly eats up the maximum cache resource limit (572 MB in this case, which I set arbitrarily in software. I don't know if Skia actually queries hardware to max this against). Then when I zoom back out, it goes back down.
I've setup an example project that emulates this with a checkbox that toggles the scale between 0.25 and 10.0. Scaling the Flare widget does cause memory consumption to go up significantly. I'll reach out to the Skia team and see if they can help further explain what's going on/what we can do to mitigate this. https://github.com/luigi-rosso/flare_leak_investigation
It does look similar. Looking forward to from Skia team about this issue.
Apparently Flutter clears up the unused cache resources after 15 seconds of them not being used, which does correspond to the time it took to clear these peaks after reducing the scale:

It seems like Flutter also exposes a way for the app to set a limit on the Skia cache usage. Try calling something like this on the device that is running out memory:
import 'package:flutter/services.dart';
...
// Tell Skia to use ~100 MB of memory max.
SystemChannels.skia.invokeMethod("Skia.setResourceCacheMaxBytes", 104857600);
Using the solution mentioned above did not solve the issue (tested on a iPhone 6plus). Seems like this cache limit in Skia is not related to the issue we observe.
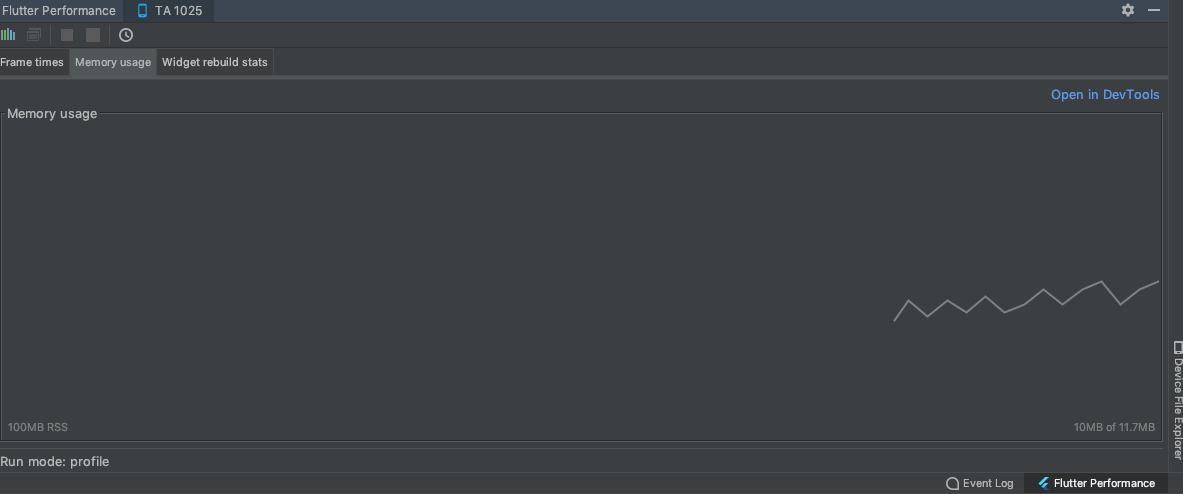
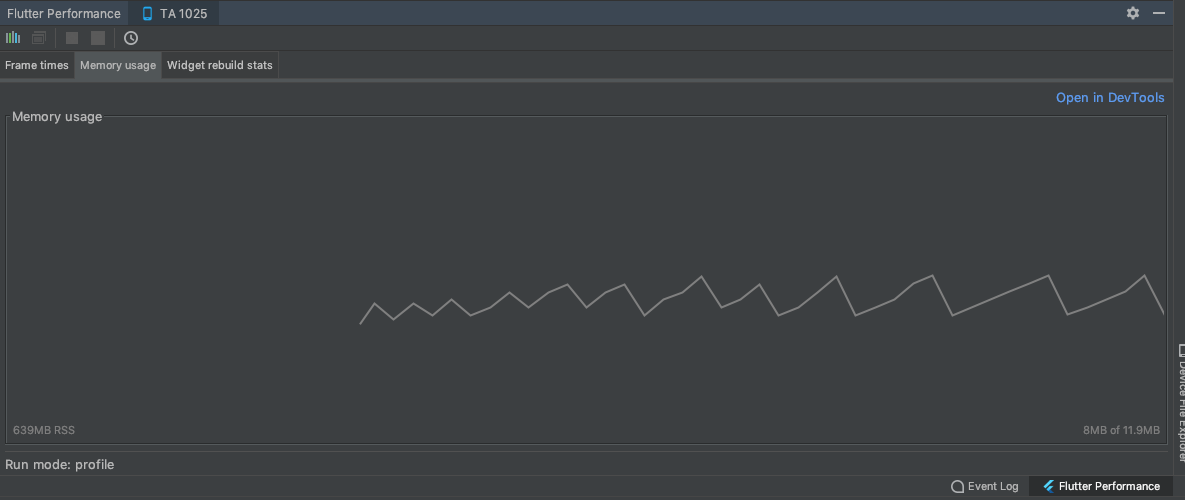
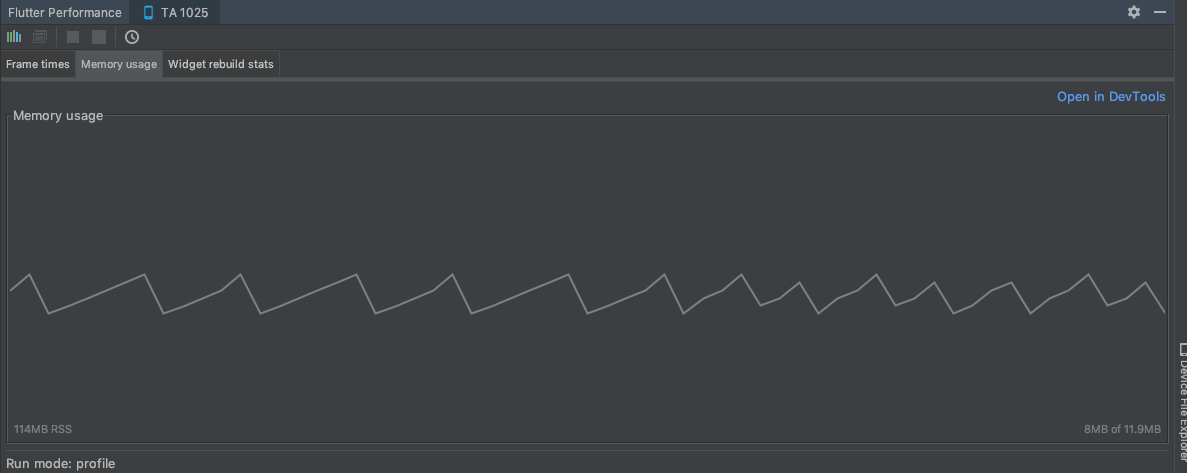
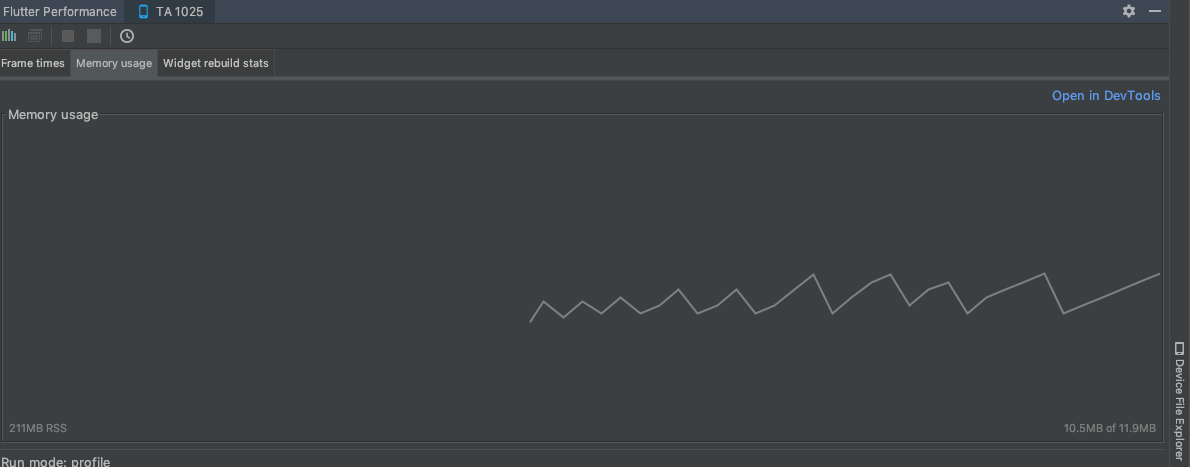
I've found a device where I can repro this better. On a Nokia 6, using the flare_leak_investigation app I see memory at around 100 MB when the app first launches (FractionallySizedBox with scale of 0.25). When I tap the checkbox, scale gets set to 4, and memory jumps to ~640MB. I uncheck it, wait 15 seconds, and it's back to 113MB.
The android profiler doesn't work with this device so I'm using the Flutter Performance tab here. I'm not sure what the RSS memory on the left is vs the memory on the right. But you can see that the memory on the right stays pretty even, while the RSS one (which I assume includes the GPU resources) skyrockets.
Start (unchecked) scale is at 0.25
Checked scale is at 4
Unchecked (after 15 seconds GPU cache resources are back down)
I did notice that calling SystemChannels.skia.invokeMethod("Skia.setResourceCacheMaxBytes", 104857600); was crashing the app in profile mode. It makes me wonder if this is having no effect in debug mode. I switched it so it calls it when the box is checked and now it works, the app only consumes 200MB when the box is checked. Which strongly suggests this is related to the Skia cache usage. I'm going to loop in @filiph to see if someone on the Flutter team can take a look or advise if I should open this issue on the Flutter repository.
Checked scale is at 4 with cache maxed at 100 MB
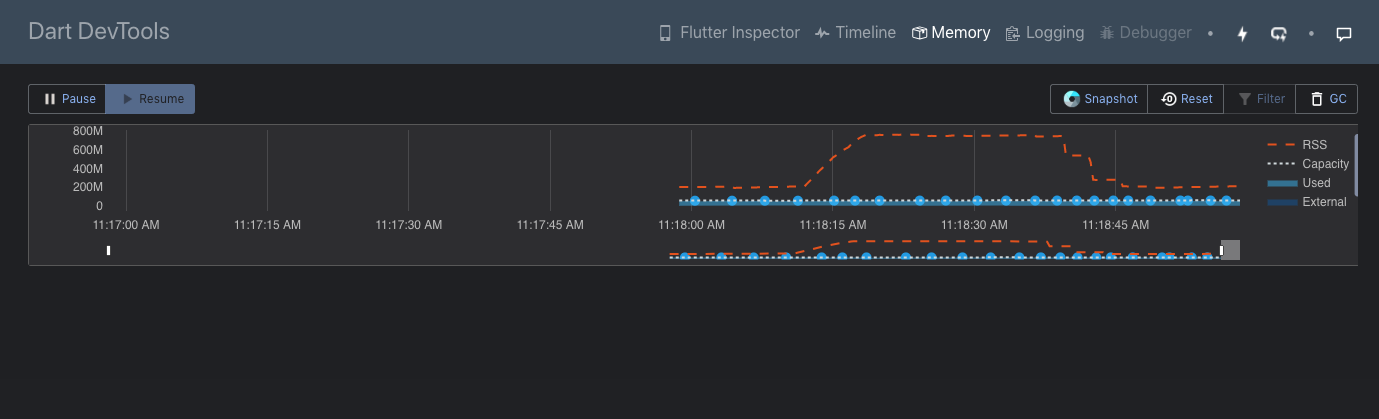
Here it is in DartDev Tools without "Skia.setResourceCacheMaxBytes":
Here it is using SystemChannels.skia.invokeMethod("Skia.setResourceCacheMaxBytes", 104857600);
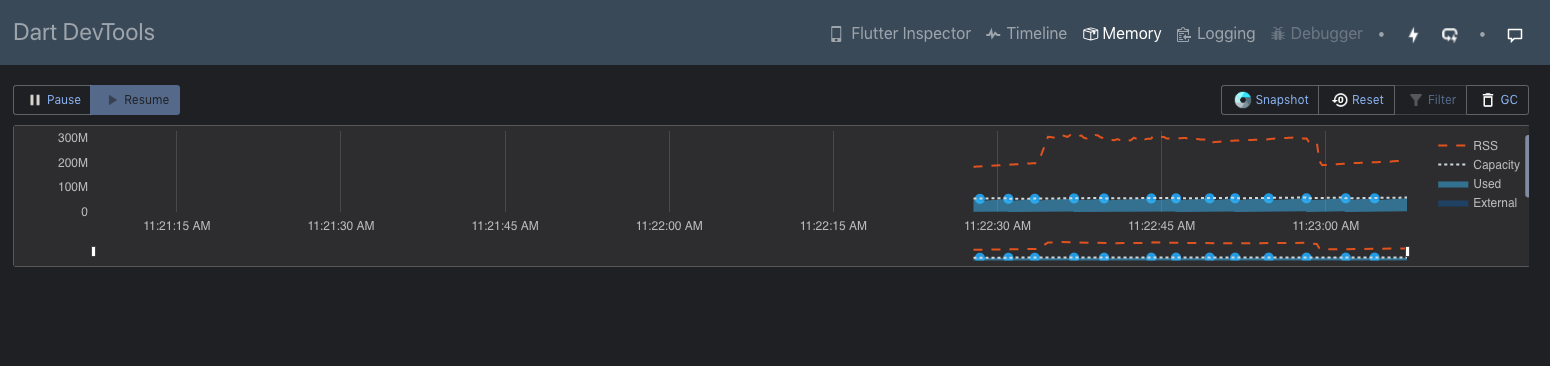
Note that the max RSS is significantly impacted (from 800 max down to 300 max), and note that it takes 15 seconds to return to normal (which is the flutter skia cleanup expiration time).
@miguelcmedeiros could you give this a try: https://github.com/luigi-rosso/flare_leak_investigation/blob/a408efc4a6de82ca706e2ad250e10848035c7a59/lib/main.dart#L7-L11
Basically do this in your main function before runApp:
 window.onReportTimings = (List<FrameTiming> frameTimings) {
    SystemChannels.skia
        .invokeMethod("Skia.setResourceCacheMaxBytes", 104857600);
    window.onReportTimings = null;
  };
This ensures that the call to limit cache usage is made after Skia has been initialized. You may want to try using 52428800 if it still crashes with 104857600.
Could you also grab another screenshot of your memory graph after doing so?
I tried the trick above on a Pixel 2 and got the following memory profile:
The app started, kept at a reasonable level (~ 220 MB total), then I put the app in the background and when I brought it back, the memory started growing again. I solved this by using WidgetsBindingObserver:
class _MyAppState extends State<MyApp> with WidgetsBindingObserver {
  AppLifecycleState _state = AppLifecycleState.resumed;

  @override
  void initState() {
    super.initState();
    WidgetsBinding.instance.addObserver(this);
    _doSomething();
  }

  @override
  void dispose() {
    WidgetsBinding.instance.removeObserver(this);
    super.dispose();
  }

  @override
  void didChangeAppLifecycleState(AppLifecycleState state) {
    super.didChangeAppLifecycleState(state);

    if (_state != state && state == AppLifecycleState.resumed) _doSomething();
    setState(() => _state = state);
  }

  void _doSomething() {
    window.onReportTimings = (List<FrameTiming> frameTimings) {
      SystemChannels.skia.invokeMethod("Skia.setResourceCacheMaxBytes", 104857600);
      window.onReportTimings = null;
    };
  }

  @override
  Widget build(BuildContext context) {
    return MaterialApp(
      home: SampleWidget(),
    );
  }
}
Did not try yet on our app, since it means pulling in flutter 1.7.4 (still using latest stable) and flare from dev branch. Give the size of the app (mono repo with multiple apps and multiple packages), it will require some effort...
Might be good to bring this to the attention of the flutter team, since the above solution is masking some nasty issue lurking inside Skia (it seems). Shall I contact them?
Ah that makes sense that Skia would be re-initialized after returning from background.
It might be a good idea to file an issue on the Flutter repo just to make sure there's a place for others to track this too. I'm not sure what the right approach is for fixing the problem, I think that's for them to decide but I see a few options:
- Leave it up to the developer to set the correct cache limit for their app and devices they want to run on (basically where we are now).
- Flutter initializes (and reinitializes) Skia with some default Cache Max Bytes that make sense for the device based on the available memory.
- Combination of 2 and the Skia team takes a look at why this seemingly (maybe naively) simple animation is using so much cache. It's my understanding from conversations with them that this is expected functionality. Skia will clear resources in the cache only after an idle period, which I'm assuming never comes if the animation keeps looping. I'm not sure why so much more cache is necessary when the shapes are scaled up, I would guess it has to do with GPU buffers they allocate behind the scenes for anti-aliasing or maybe larger vertex buffers if they do any subdivision in software (unless they're using some Loop Blinn style algorithm for the fill). I remember trying to disable anti-aliasing and not seeing a difference.
I'm available to help in whatever capacity they'd find useful. Maybe I could try to setup a simple example without Flare that exposes this same issue.
@luigi-rosso, it took me a while to bring this issue to the flutter team, but while doing so, I actually found that there's already an issue for it: https://github.com/flutter/flutter/issues/35038
A fix for it seems to have landed today in flutter/engine. I'll give it a go once it lands in a dev release of the framework.
Some changes have landed in Flutter in the last couple days that should help this.
More specifically, two changes:
- On iOS, when the system sends a memory pressure event, we'll evict the Skia cache
- On all platforms, we'll base the cache size on a multiple of the screen resolution, rather than hard coding it to a value that was too large.'
These changes led from History of Everything using over 1gb of ram to topping out around 400-500.
Hi, from the version higher than 1.17 of flutter this has occurred again when loading a new .flr file the occupied memory is not released Any recommendation? I have tried with all the superior versions and in all there is the problem