152056212
152056212
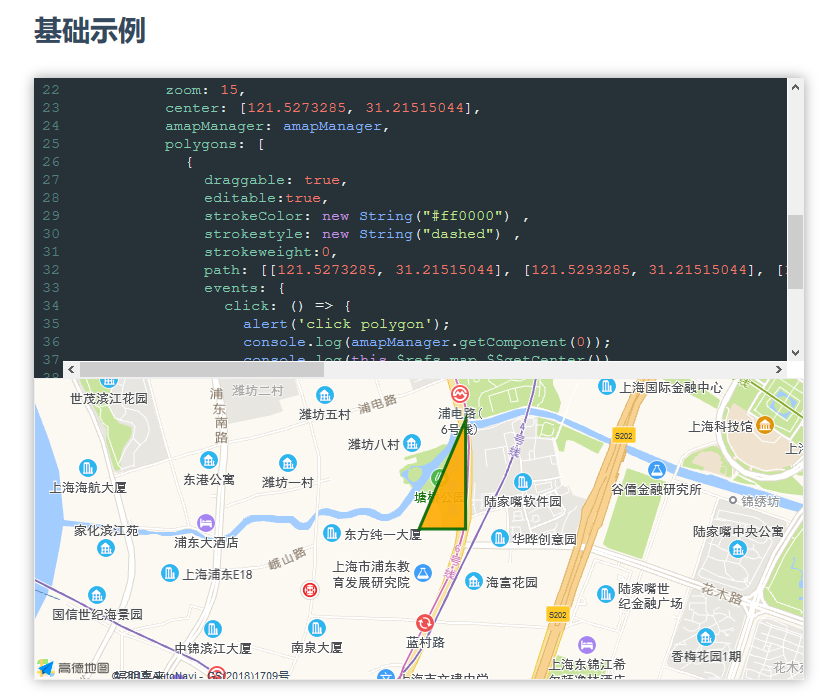
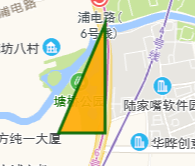
## 问题 在官方提供的文档演示示例中,即多边形基础示例中,修改多边形的边界点坐标属性,添加多边形边框样式以及多边形边框的颜色值,运行后没有显示预定的样式效果。  ### VueAMap 版本 无 ### OS/Browsers version 火狐浏览器 ### Vue 版本 无 ### 复现地址 https://elemefe.github.io/vue-amap/#/zh-cn/coverings/polygon ### 预期 红色边框(#ff0000)并且是虚线 ### 实际  ## feature request
- **F2 Version**: 4.0.48 - **Platform**: 微信小程序 - **Mini Showcase(like screenshots)**:  - **CodeSandbox Link**: https://codesandbox.io/s/f2-reproduction-template-forked-qhtlpf?file=/src/index.js 问题总结:F2折线图xAxis最右边的值被遮挡无法显示全 具体描述:如图所示,x轴最右边的值为2012-01-01 08:00,但是渲染的结果中只显示了“2012-01-01 08”
1. I do this query : BBOX(geom, 118.180168,24.060873,118.28798,24.149692) AND dtg DURING 2017-01-01T07:14:00+00:00/2017-01-01T08:20:00+00:00 2. Console log is : createQueryPlan QueryStrategy(**Z3Index(geom,dtg)[BBOX(geom, 118.180168,24.060873,118.28798,24.149692) AND dtg DURING 2017-01-01T07:14:00+00:00/2017-01-01T08:20:00+00:00]**[None],Stream(BoundedByteRange([B@100c567f,[B@30c0d731), ?),Stream(BoundedRange(Z3IndexKey(2452,4299856006940196864),Z3IndexKey(2452,4299856006956974079)), ?),List(),None,Hints: org.geotools.util.factory.Hints$ClassKey@325bb9a6 = SimpleFeatureType ais-quickstart...
