Breakpoints not working, but xdebug_break() works
PHP version: 8.0.0 Xdebug version: 3.0.4 VS Code extension version: 1.16.3
Your launch.json: launch.json.txt
Xdebug php.ini config:
[XDebug] zend_extension=C:\xampp_\php\ext\php_xdebug.dll xdebug.remote_autostart = 1 xdebug.remote_enable = 1 xdebug.default_enable = 1 xdebug.mode=debug
Xdebug logfile (from setting xdebug.log in php.ini):
xdebug.log
VS Code extension logfile (from setting "log": true in launch.json):
vs_code_part_log.txt
Code snippet to reproduce:
Hi. The vs_code_part_log.txt has only 3 lines in there, not much to go on. And the breakpoint ID is not in the other log either. And I cannot find an instance of execution break to see how Xdebug sees the files either. Could you get me a full log from VS Code debug panel
Hi. Thanks for the logs. They do show some strange things, but it would help if I could also see the file.
The log shows: breakpoints on lines 65, 69.
First execution line is 70 (stopOnentry).
Break after continue, again line 70. This is strange.
On what line is xdebug_break() ?
Ideally, if possible, clean up the file of any sensitive content and attach it here.
Best, Damjan
The file has copyrights and unfortunately it won't be possible to publish
Hi. I completely understand.
Do you think you could try to create a simple file that also demonstrates such behavior?
My question about your current source would be: if line 70 is the first line to be executed, and xdebug_break is on it whats is in all the lines before? You define two breakpoints. Are they inside functions? Classes?
Best!
Here is the requested scenario

xdebug.log is empty
I am having the same issue, suddenly I can't make the debugger stop on any breakpoints. One day it worked, the next, nothing. So, a bit weird. Perhaps VSCode updated itself in the interim, but php.ini and launch.json haven't changed for months.
Hi @marlboroman3.
I am having the same issue, suddenly I can't make the debugger stop on any breakpoints. One day it worked, the next, nothing. So, a bit weird. Perhaps VSCode updated itself in the interim, but php.ini and launch.json haven't changed for months. Can you also provide some info about your setup?:
- VS Code version
- php-debug extension version
- Xdebug version
- PHP version
- Xdebug related php.ini directives
- attach launch.json file that you are using
- what configuration is selected in RUN AND DEBUG
- describe how you run php:
- is it a script executed on the same system as VS Code
- is it inside WSL
- is it inside Docker or other container
- is it on a remote server and you are using Samba network file system to access the files
- is it on a remote server and you are using VS Code Remote
- other combinations?
- if possible, state the path to your workspace and if in a remote/container the path where php files are
- make a small php file to reproduce the issue and attach this file so we can try to reproduce the issue ourselves,
- add
"log":trueto your launch.json configuration - add
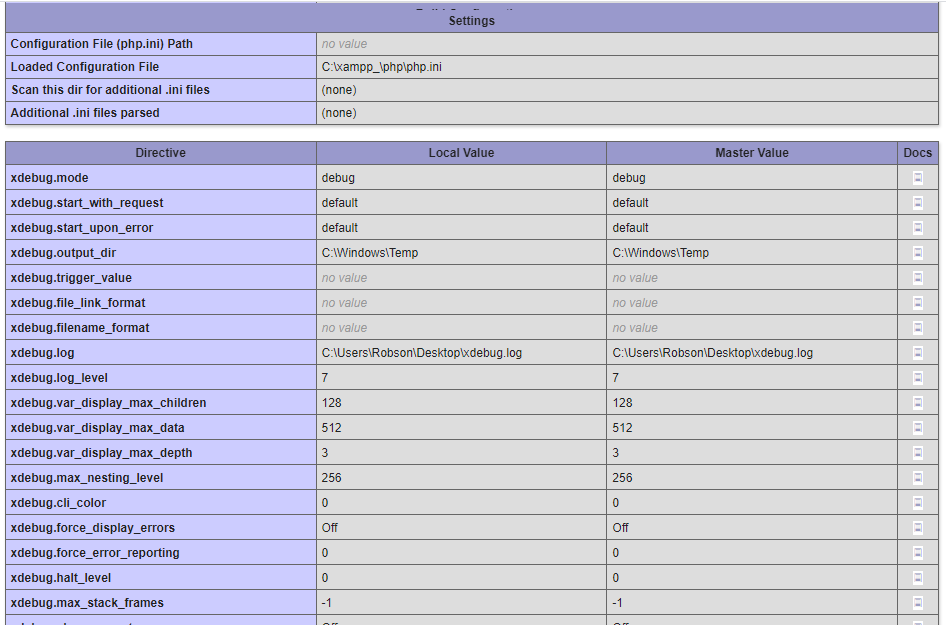
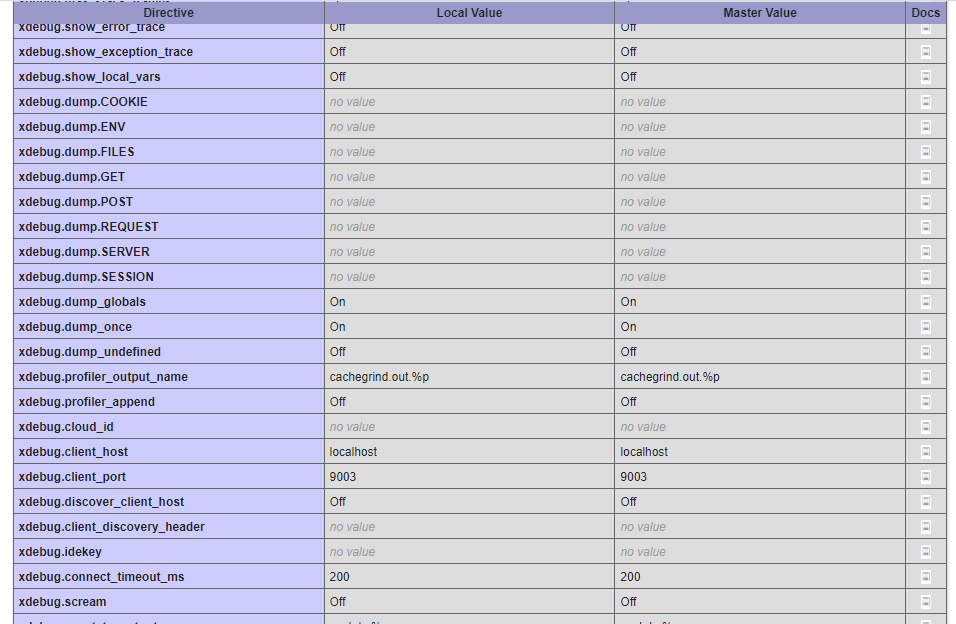
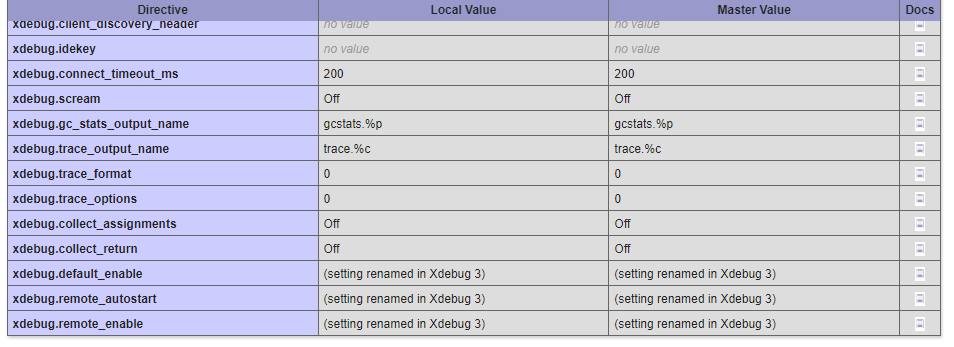
xdebug_info()to your code (only Xdebug 3) and attach a screen show of the output - attach the whole output of DEBUG CONSOLE (right click, Copy All) after reproducing the issue.
It's best if you open up a new issue with all this information attached. Let me know if it's clear what I need, and I will try to improve the issue template to provide users with a better starting point.
Hi @robson-alcantara , sorry for not getting back earlier. See the previous post if there is any more info you can provide. Since there was no Xdebug/DBGp connection in your case, please run a xdebug_info() and attach a screenshot of that if it helps us determine the source of the issue.