vscode-php-debug
 vscode-php-debug copied to clipboard
Feature: Don't break in vendor files (Just My Code)
Summary: it should be possible for to skip all code in vendor files when using the "Step Into" function, only stopping in application source files. Likewise, it should be possible that when an exception or error is thrown inside a vendor file which causes a break, to by default bubble up the stack frame and show the last line of code in your application source (the line of your application code that ran the vendor function that encountered the error, rather than the vendor code itself).
This could of course be optional in case debugging vendor files is deemed necessary by the developer, but I don't really think that should be a common case. This feature is known as Just My Code in Visual Studio.
This feature request has two parts: stepping and breaking. Both can be demonstrated with the following code set up.
Say you have the following code in a vendor file ./vendor/example.php:
function run_callback($fn) {
    try {
        $fn();
    } catch ($e) {
        throw new RuntimeException('Error in callback');
    }
}
And this code in your project ./index.php:
include '../vendor/example.php';

run_callback(function () {
    throw new RuntimeException('Hi!');
});
If we place a breakpoint on the run_callback(function () { line, and then use "Step Into", it should be possible to go straight to the next line in the same file, rather than having to step through the vendor file (and possibly navigate any other logic that ends up calling the callback).
When the exception is thrown within our callback, it should of course break there as usual and show that line. When the exception is thrown within the vendor file, it should still break in the vendor file, but we shouldn't be presented with that vendor file and have it opened up. Rather the debugger should scan up through the stack frame for the first file which isn't in a configured ignore glob pattern list and show us that line instead.
We are still free to navigate the entire stack frame ourselves and see exactly where the break occurred in the vendor file, but the vendor files won't be opened up and revealed by default, resulting in not opening and looking at a lot of files that usually don't need to be opened and looked at, as it's not common to debug vendor files.
I am willing and would be happy to attempt to create a pull request for this feature but cannot guarantee to be able to do it quickly, well or at all due to my limited experience with TypeScript.
Hello
A few years later, did this feature has been added to php-debug? I'm also trying to find how to skip any vendor third parties when I click on the "Step over" button. I just want to navigate inside my own code; not vendor's ones.
Thanks
Hi! No this was not implemented, however the reason lies with Xdebug. The only way to implement it right now would be to detect that a break/step occured outside of "my code" and the perform "step in" operations until we end up again in our code.
This would in most cases be veeeeery slow.
On a positive note, Derick is considering adding some functionality to Xdebug that would make this feature possible.
Thanks @zobo , I can thus stop to search for this ;-)
Hoping that some day, it would be possible... (I'm trying to debug a PHP unit test case and the "Step over" feature is "pollute" by jumping in to much files under /vendor/phpunit making just impossible to debug)
Hm. Can you explain a bit more what you think with entering vendor with "step over"? Because if you are in one file, and "step over" you should not land inside any other function?
Thanks for the interest!
Below my test unit ("my code"). (I'm hiding data because company's ones)
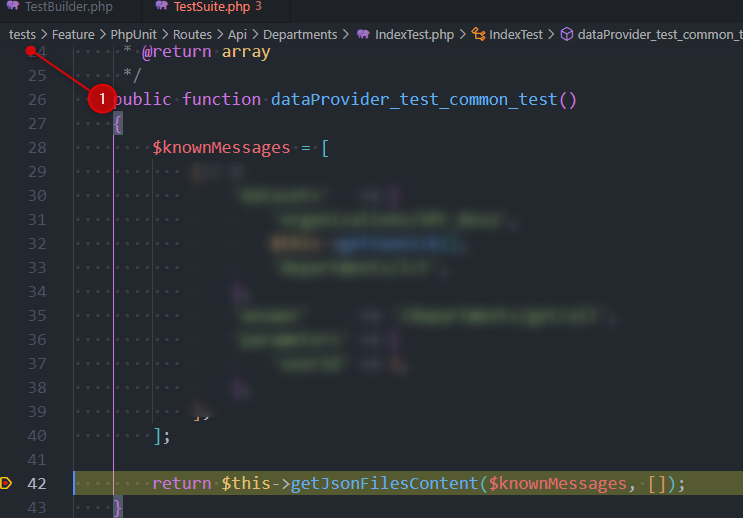
- So the code has been stopped due to my breakpoint; nice.
- I click on the "Step over" button (F10) and then, vscode is showing me a script under
/vendor/phpunit/...
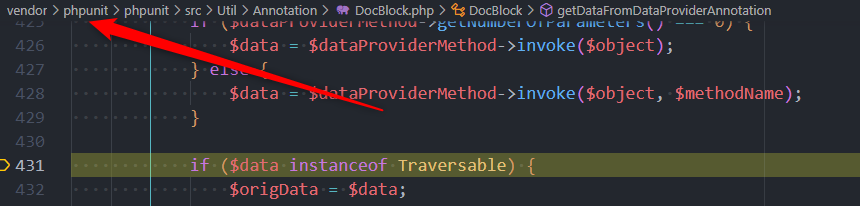
And from here, it's in fact a pitty since I'll jump in functions defined by phpunit developpers... Same for Laravel... i.e. I just want to jump in my code; not theirs.
(am I doing something wrong?)
Below my .vscode/launch.json file:
{
    "version": "0.2.0",
    "configurations": [
        {
            "name": "Listen for XDebug",
            "type": "php",
            "request": "launch",
            "port": 9102,
            "ignore": [
                "/var/www/vendor/**/*"
            ],
            "hostname": "localhost",
            "pathMappings": {
                "/var/www": "${workspaceFolder}"
            },
            "xdebugSettings": {
                "max_data": -1,
                "max_children": -1
            },
            "stopOnEntry": false,
        }
    ]
}
More info, I'm using Windows but working in WSL2 (linux thus) and I've only one breakpoint (my unit test).
Thanks
This is indeed strange. Do you have any exception filters turned on? There where the breakpoints are listed. Make sure "Everything" is unchecked and try to uncheck Exceptions, Errors, Warnings. If you can, please share the log file, you can also send it to my mail.
Added an implementation to skipFiles. #874
Initial implementation was to use ignore array and a boolean flag justMyCode similar to Python debugger. Switched then to skipFiles same way javascript debugger does.
Will close this issue.