ipyvolume
 ipyvolume copied to clipboard
Simple example for bitmap/image/texture
I was looking for a really simple small example to get started with putting raster images into a plot. In my case I want to add map tiles and show some data on top. But all I've found so far are quite convoluted examples that scare me off. Anything shorter would be much appreciated. ;)
Would the commented out code here help: https://ipyvolume.readthedocs.io/en/latest/mesh.html#Texture-mapping ?
Well, I was trying that before, but it causes an error due to the unspecified X, Y, Z arrays (below I've only renamed p3 to ipv). The code is for making some animation, while the first step for me would be to plot one image somewhere. I've tried ipv.plot(... texture=image...), too, but no luck.
fig = ipv.figure()
ipv.style.use('dark')
# we create a sequence of 8 u v coordinates so that the texture moves across the surface.
u = np.array([X/5 +np.sin(k/8*np.pi)*4. for k in range(8)])
v = np.array([-Y/5*(1-k/7.) + Z*(k/7.) for k in range(8)])
# mesh = ipv.plot_mesh(X, Z, Y, u=u, v=v, texture=image, wireframe=False)
# ipv.animation_control(mesh, interval=800, sequence_length=8)
ipv.show()
Those are a few cells above it, if you put it together you get:
import ipyvolume as ipv
import numpy as np
!curl http://localhost:8888/static/base/images/logo.png -o logo.png
image = PIL.Image.open('logo.png')
fig = ipv.figure()
ipv.style.use('dark')
# we create a sequence of 8 u v coordinates so that the texture moves across the surface.
X = np.arange(-5, 5, 0.25*1)
Y = np.arange(-5, 5, 0.25*1)
X, Y = np.meshgrid(X, Y)
R = np.sqrt(X**2 + Y**2)
Z = np.sin(R)
u = np.array([X/5 +np.sin(k/8*np.pi)*4. for k in range(8)])
v = np.array([-Y/5*(1-k/7.) + Z*(k/7.) for k in range(8)])
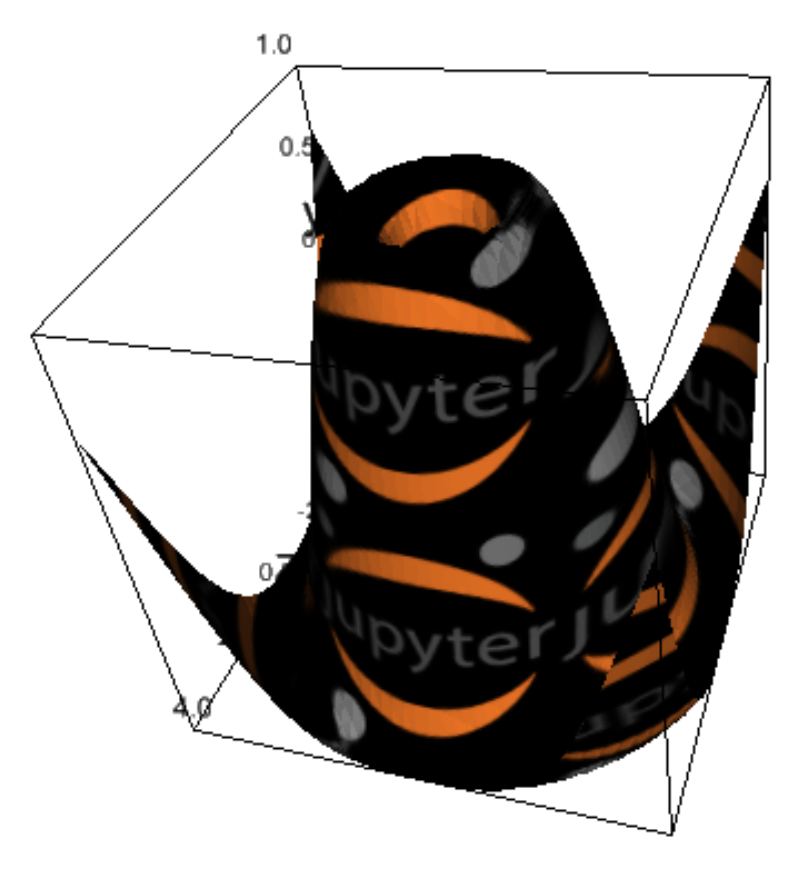
mesh = ipv.plot_mesh(X, Z, Y, u=u, v=v, texture=image, wireframe=False)
# ipv.animation_control(mesh, interval=800, sequence_length=8)
ipv.show()
Hope that helps.
Ok, I got it working. Basically I need to copy these lines from snippets above on that page:
X = np.arange(-5, 5, 0.25*1)
Y = np.arange(-5, 5, 0.25*1)
X, Y = np.meshgrid(X, Y)
R = np.sqrt(X**2 + Y**2)
Z = np.sin(R)
It's all cool, just asking for a little more intuition than I expected. ;) Maybe the code is commented, because it wouldn't work as-is on readthedocs.io?
I am not sure actually why it was commented out. Great that it is work!
- I have tried the texture example unsuccessfully (I am pretty sure I have copied it carefully). Perhaps something in my environment is not well settled, it seems to me that the image of the jupyter logo (open with the pil.Image.open() command) is closed when trying the mesh command (I don't know why, I have displayed the image after open it and it displays well (even I have asked to rotate it 45° and do it right) but then when arrives to the mesh line it sends an error which ends with ... ~\anaconda3\envs\T3Dgraph\lib\site-packages\PIL\ImageFile.py in _safe_read(fp, size) 547 return b"" 548 if size <= SAFEBLOCK: --> 549 return fp.read(size) 550 data = [] 551 while size > 0:
ValueError: read of closed file
2.Also, I want to tell you that I have fixed some warnings in the widgets.py (line 179) and utils.py (line 204) scripts of tomography head example: in line 179, I have changed data_view = self.data_original[view] by: data_view = self.data_original[(view)] in line 204: data = (data[slices1] + data[slices2])/2 by: data = (data[(slices1)] + data[(slices2)])/2
I would like to know if you have some idea of what am I making wrong, why the image file is closed when it is called by the ipv.plot.mesh command with the texture=im option in the command is used. I am going to use your ipyvolume 3D graphing module in my python lectures, and I would appreciate very much any suggestion you can give me. Thank you very much. Jorge Sanchez