puppetboard
 puppetboard copied to clipboard
Chart/Graph to show raw values
As an operator When i create a report for a fact And view the returned values I would like a summary of each of the unique values that are included
For example, the chart below shows a custom fact for our product blocks, but having 12.5% of machines with a given fact isn't that useful.
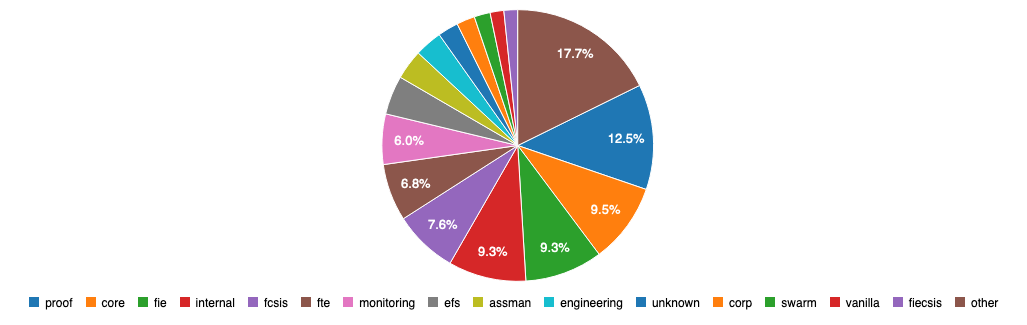
Ideally i'd like some sort of table that shows the raw returned values for each of the segments, ideally something that'd be friendly to copy/paste into emails etc.
Hi @warmfusion , nice proposal! This would require some hacking with a custom legend for C3 chart as documented at https://c3js.org/samples/legend_custom.html . I am not very good at JS though so PRs from someone who knows how to do it would be very welcome!