vizzu-lib
 vizzu-lib copied to clipboard
Connectiontype over missing line/area elements
Task: We need a new channel parameter: connectiontype If the user filters from the data series on the X-axis (parallel to the line or area), then: 1.) connect on - we connect the lines and the area. 2.) connect off - we "cut" the lines and the area, they are not connected, and they end at the height of the remaining values that were not filtered out.
So I am very much sure my data does not end with low values right now.
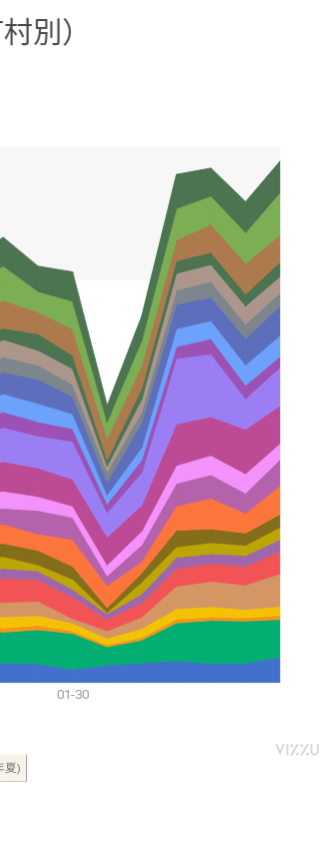
But every day, the graph still ends as it seems to require finishing down its drawing to zero.
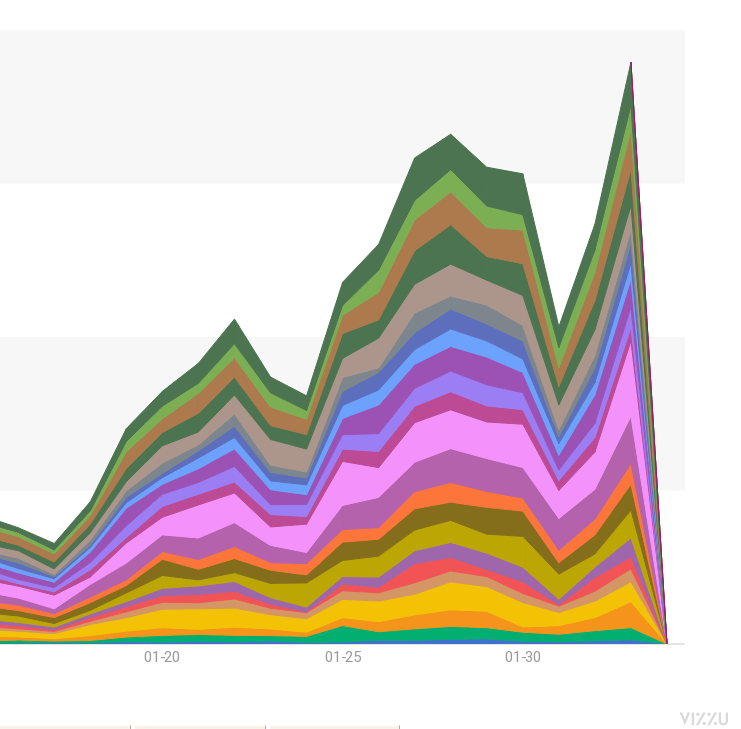
It is possible that's within Vizzu's engine that it drops to low values near the end like that?
Expected
- last days of data should reflect actual data
Actual
- drops to zero every day
Thanks
No, it should not go down to zero on its own: https://jsfiddle.net/VizzuHQ/dk7b86vc/76/
Do you filter out values by date? It seems like the last values on the x axis are filtered out.
I managed to reproduce the problem by filtering out the last value on the X-axis: https://jsfiddle.net/VizzuHQ/dk7b86vc/81/
No I am not filtering recent data. And numbers are up for every "categories" right now.
I tried to replace the 'max' x value by being explicit. That's all.
Thanks for your example. I will check when I get home. but I don't know what I could be doing differently.
Could be directly related to my other issue that have a blank value.
I can try to reproduce with a smaller dataset
I updated your example to be more similar with my code but still cannot reproduce
https://jsfiddle.net/h5s3gfk6/1/
There, I could reproduce both this bug and #65
https://jsfiddle.net/h5s3gfk6/2/
Apparently both are related.
Occurs when there are more series in the data.
confirmed, if I remove the other series from the data, I don't have that problem...

but I can't use animate to switch data as easily as setting x/y sets like I am doing...
I tried making this change. initial chart loads but animate to switch data won't work..
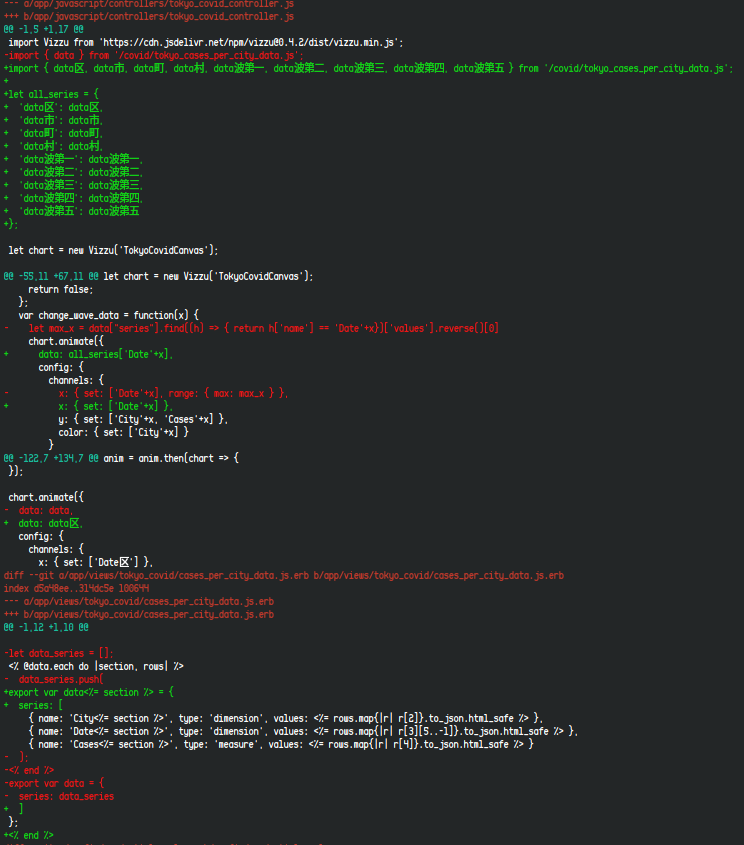
Ideally, Vizzu should only take the sets specified into consideration when drawing the chart.
      config: {
        channels: {
          x: { set: ['Date'+x] },
          y: { set: ['City'+x, 'Cases'+x] },
          color: { set: ['City'+x] }
        }
And ignore other series from the data.
Thanks
simplest way to reproduce
import Vizzu from 'https://cdn.jsdelivr.net/npm/vizzu@latest/dist/vizzu.min.js';

let data = {
  series: [
    { name: 'Sports', type: 'dimension', values: [
    	'Basket', 'Volley', 'Tennis', 'Basket', 'Volley', 'Tennis',
      'Basket', 'Volley', 'Tennis', 'Basket', 'Volley', 'Tennis',
      'Basket', 'Volley', 'Tennis', 'Basket', 'Volley', 'Tennis'] },
    { name: 'Friends', type: 'dimension', values: [
    	'Alice', 'Alice', 'Alice', 'Bob', 'Bob', 'Bob',
      'Mary', 'Mary', 'Mary', 'Maurice', 'Maurice', 'Maurice',
      'Jessica', 'Jessica', 'Jessica', 'Ted', 'Ted', 'Ted'] },
    { name: 'Scores', type: 'measure', values: [
      15, 32, 120, 45, 34, 87,
      32, 66, 69, 100, 200, 300,
      30, 60, 70, 60, 70, 120
    ] },
    { name: 'Unrelated', values: [1,2,3,4,5,6,7,8,9,10,11,12,13,14,15,16,17,18,19]}
  ]
};

let chart = new Vizzu("myVizzu", { data });

chart.animate({
  channels: {
    x: { set: ['Friends'] },
    y: { set: ['Sports', 'Scores'] },
    color: { set: ['Sports'] }
  },
  geometry: 'area'
});
https://jsfiddle.net/h5s3gfk6/3/
Until this is fixed, you could try to set the range of the X axis to range: { min: 0.5, max: '-1.5max' }
https://jsfiddle.net/VizzuHQ/krvnaf2q/5/
I just realized that the 'Unrelated' data series is one value longer than the others. This'll cause Vizzu to append an empty value at the end of all the others. That is the cause of both the empty legend entry and the drop at the end.
I just realized that the 'Unrelated' data series is one value longer than the others. This'll cause Vizzu to append an empty value at the end of all the others. That is the cause of both the empty legend entry and the drop at the end.
That's exactly what I am thinking as well