postgresql_cluster
 postgresql_cluster copied to clipboard
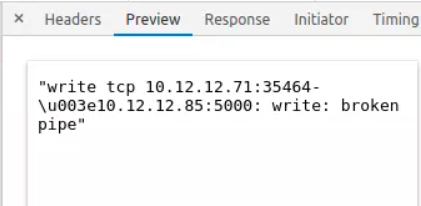
Broken Pipe
I used the playbook to deploy the full solution with no issues. but I keep getting errors from the app with errors of that broken pipe and the VIP of keepalive service with port 5000. the app is written in GOLANG. is there any config that courses this issue could I change it to solve it.
@asobeeh There may be many reasons because of which your application cannot connect to the database. For example, network problems.
If you use pgbouncer connection pooler, make sure that you configured the sufficient pool size.
Check the pgbouncer log (/var/log/pgbouncer/pgbouncer.log)
And what pool mode do you use, Session (Default) or Transaction?
Check the pgbouncer log (/var/log/pgbouncer/pgbouncer.log)
normal log nothing there
2021-03-31 02:53:30.555 +03 [2661896] LOG stats: 0 xacts/s, 0 queries/s, in 0 B/s, out 0 B/s, xact 0 us, query 0 us, wait 0 us 2021-03-31 02:54:30.555 +03 [2661896] LOG stats: 0 xacts/s, 0 queries/s, in 0 B/s, out 0 B/s, xact 0 us, query 0 us, wait 0 us 2021-03-31 02:55:30.555 +03 [2661896] LOG stats: 0 xacts/s, 0 queries/s, in 0 B/s, out 0 B/s, xact 0 us, query 0 us, wait 0 us 2021-03-31 02:56:30.555 +03 [2661896] LOG stats: 0 xacts/s, 0 queries/s, in 0 B/s, out 0 B/s, xact 0 us, query 0 us, wait 0 us 2021-03-31 02:57:30.555 +03 [2661896] LOG stats: 0 xacts/s, 0 queries/s, in 0 B/s, out 0 B/s, xact 0 us, query 0 us, wait 0 us 2021-03-31 02:58:30.554 +03 [2661896] LOG stats: 0 xacts/s, 0 queries/s, in 0 B/s, out 0 B/s, xact 0 us, query 0 us, wait 0 us 2021-03-31 02:59:30.554 +03 [2661896] LOG stats: 0 xacts/s, 0 queries/s, in 0 B/s, out 0 B/s, xact 0 us, query 0 us, wait 0 us 2021-03-31 03:00:30.554 +03 [2661896] LOG stats: 0 xacts/s, 0 queries/s, in 0 B/s, out 0 B/s, xact 0 us, query 0 us, wait 0 us 2021-03-31 03:01:30.554 +03 [2661896] LOG stats: 0 xacts/s, 0 queries/s, in 0 B/s, out 0 B/s, xact 0 us, query 0 us, wait 0 us 2021-03-31 03:02:30.554 +03 [2661896] LOG stats: 0 xacts/s, 0 queries/s, in 0 B/s, out 0 B/s, xact 0 us, query 0 us, wait 0 us 2021-03-31 03:03:30.554 +03 [2661896] LOG stats: 0 xacts/s, 0 queries/s, in 0 B/s, out 0 B/s, xact 0 us, query 0 us, wait 0 us 2021-03-31 03:04:30.554 +03 [2661896] LOG stats: 0 xacts/s, 0 queries/s, in 0 B/s, out 0 B/s, xact 0 us, query 0 us, wait 0 us 2021-03-31 03:05:30.555 +03 [2661896] LOG stats: 0 xacts/s, 0 queries/s, in 0 B/s, out 0 B/s, xact 0 us, query 0 us, wait 0 us 2021-03-31 03:06:30.554 +03 [2661896] LOG stats: 0 xacts/s, 0 queries/s, in 0 B/s, out 0 B/s, xact 0 us, query 0 us, wait 0 us
If you use pgbouncer connection pooler, make sure that you configured the sufficient pool size.
the pool size as below default_pool_size = 100
Check the pgbouncer log (
/var/log/pgbouncer/pgbouncer.log)And what pool mode do you use, Session (Default) or Transaction? i am using the default one
pool_mode = session server_reset_query = DISCARD ALL max_client_conn = 10000 default_pool_size = 100 reserve_pool_size = 50 reserve_pool_timeout = 2 max_db_connections = 100 pkt_buf = 8192 listen_backlog = 4096
log_connections = 0 log_disconnections = 0
@asobeeh Are these related issues https://github.com/vitabaks/postgresql_cluster/issues/94 ?
@asobeeh Are these related issues #94 ?
no, it's not. it is another issue. I have tried to connect without the pgbouncer to forward the connection from HAproxy to PostgreSQL port direct 5432 I changed the max connection from 100 to 1000 but still keep getting broken pipe
How many connections does your application create?
select count(*) from pg_stat_activity;
Is your application using persistent connections?
Check out Are there any errors in the postgresql log?
How many connections does your application create?
select count(*) from pg_stat_activity;
select count(*) from pg_stat_activity; count | 8
Is your application using persistent connections?
Yes presistant connection
Check out Are there any errors in the postgresql log?
no errors clear error we can notice.
Yes presistant connection
check tcp_keepalive* settings. http://postgresql.freeideas.cz/hanging-postgresql-session-called-go-lang-node-js-program/ https://stackoverflow.com/questions/31259154/database-hangs-if-not-used
or
try to increase the value for haproxy timeouts /etc/confd/templates/haproxy.tmpl
I have tried to directly connect to the server IP ignoring keep alive service to check if the issue from it or not I increased the value of timeouts for HAproxy but it in some times gives that broken pipe, but for a day does not
the below screenshot shows the number of happened broken pipe
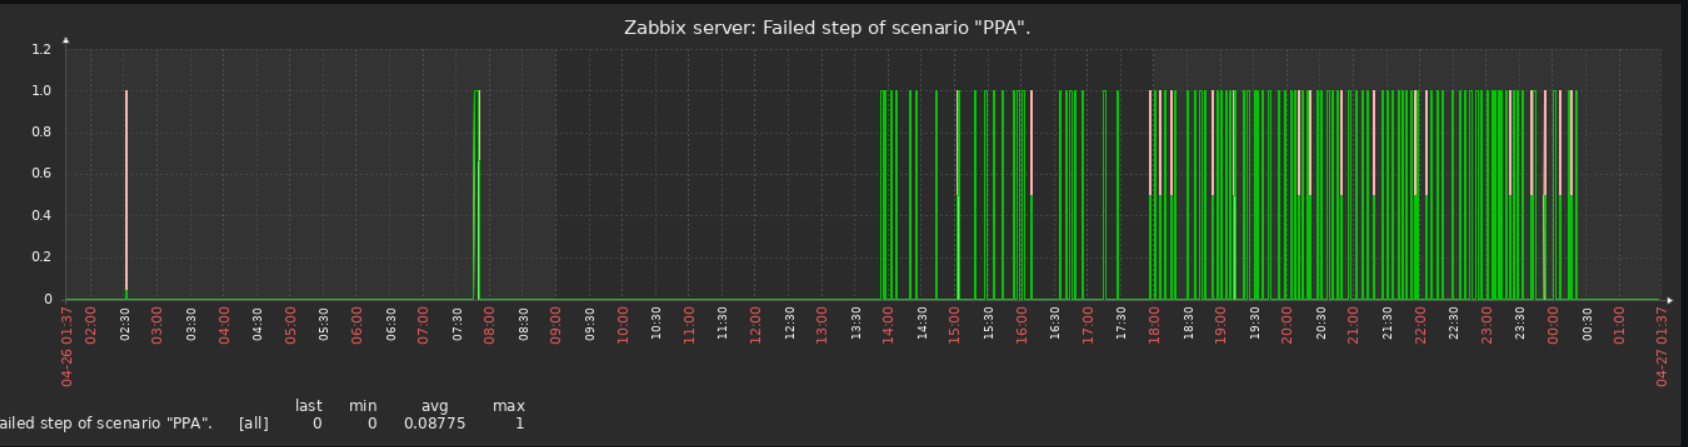
value 0 means service is ok value 1 means a broken pipe issue this for yesterday today it is ok
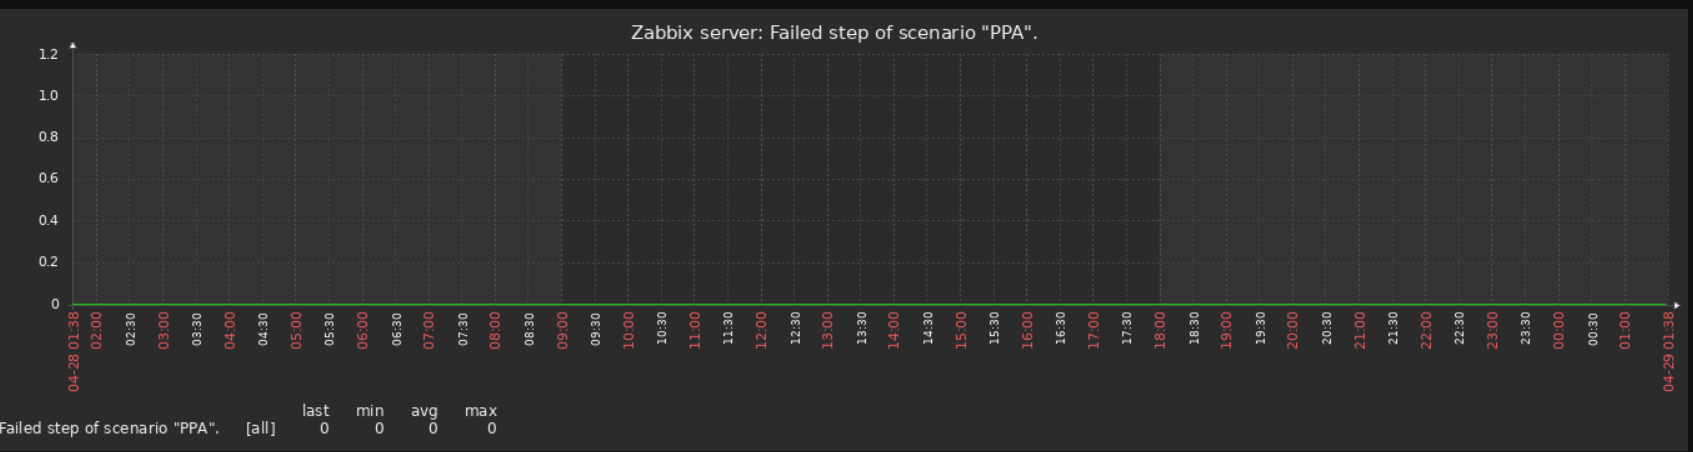
what can I check or what should I do here, can you please advice me with that I have tried almost everything got in my mind
Configure tcp_keepalives settings for PostgreSQL: https://github.com/vitabaks/postgresql_cluster/commit/53edccdc5d55e0ab99b10da02bab0aabc9548192