syncthing
 syncthing copied to clipboard
Suspecting a memory leak related to QUIC connections
Does your log mention database corruption?
If your Syncthing log reports panics because of database corruption it is most likely a fault with your system's storage or memory. Affected log entries will contain lines starting with
panic: leveldb. You will need to delete the index database to clear this, by runningsyncthing -reset-database.
No
Include required information
Please be sure to include at least:
-
which version of Syncthing and what operating system you are using
syncthing v1.19.1 "Fermium Flea" (go1.17.6 darwin-arm64) [email protected] 2022-02-21 13:57:21 UTC [noupgrade](via homebrew)- macOS Monterey 12.3, MacBook Pro (2021), 32GB RAM
-
browser and version, if applicable: 'N/A'
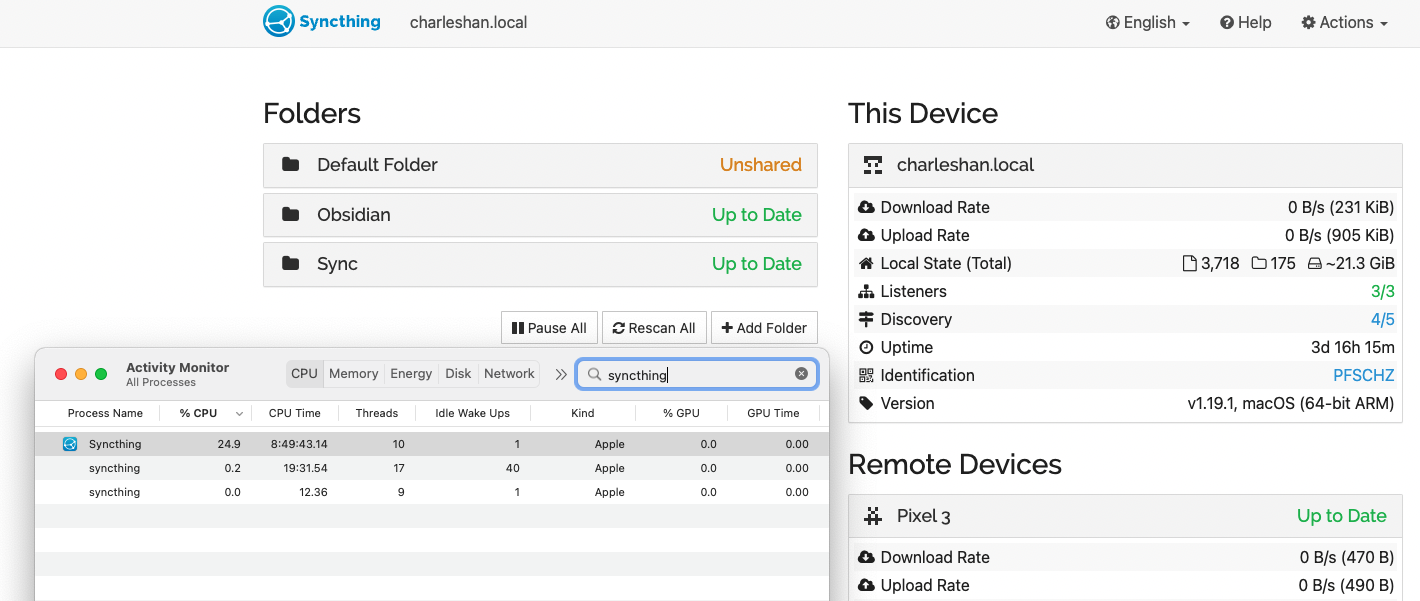
After running for a few days syncthing takes up almost 1 GB of RAM, which is unexpected for a machine with just 1 shared folder with: 269 files, 22 folders and ~628 MiB total size. The contents of the folder don't change that often, and a few days ago the RAM usage was way lower. syncthing hasn't been interacted with in these last two days. syncthing is running for about a week now.
| March 28th | March 30th |
|---|---|
 |
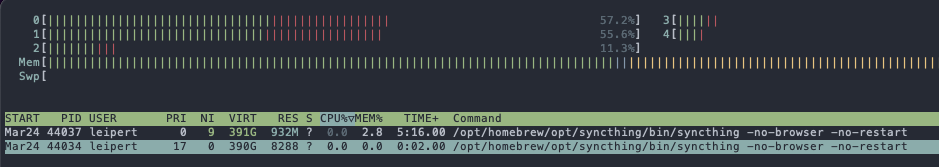 |
| 394 MB RAM | 932 MB RAM |
I know that this bug report is not super helpful. I am not a go developer, and have no idea how to debug. It is also a little tricky, because memory usage seems to ramp over time. Could be that due to the 32GB RAM, garbage collection doesn't kick in yet?
How can I help debugging this?
- You can try our binary instead of Homebrew (though it should be equivalent I'm not sure how they build/cross build)
- You can take a heap profile: https://docs.syncthing.net/users/profiling.html
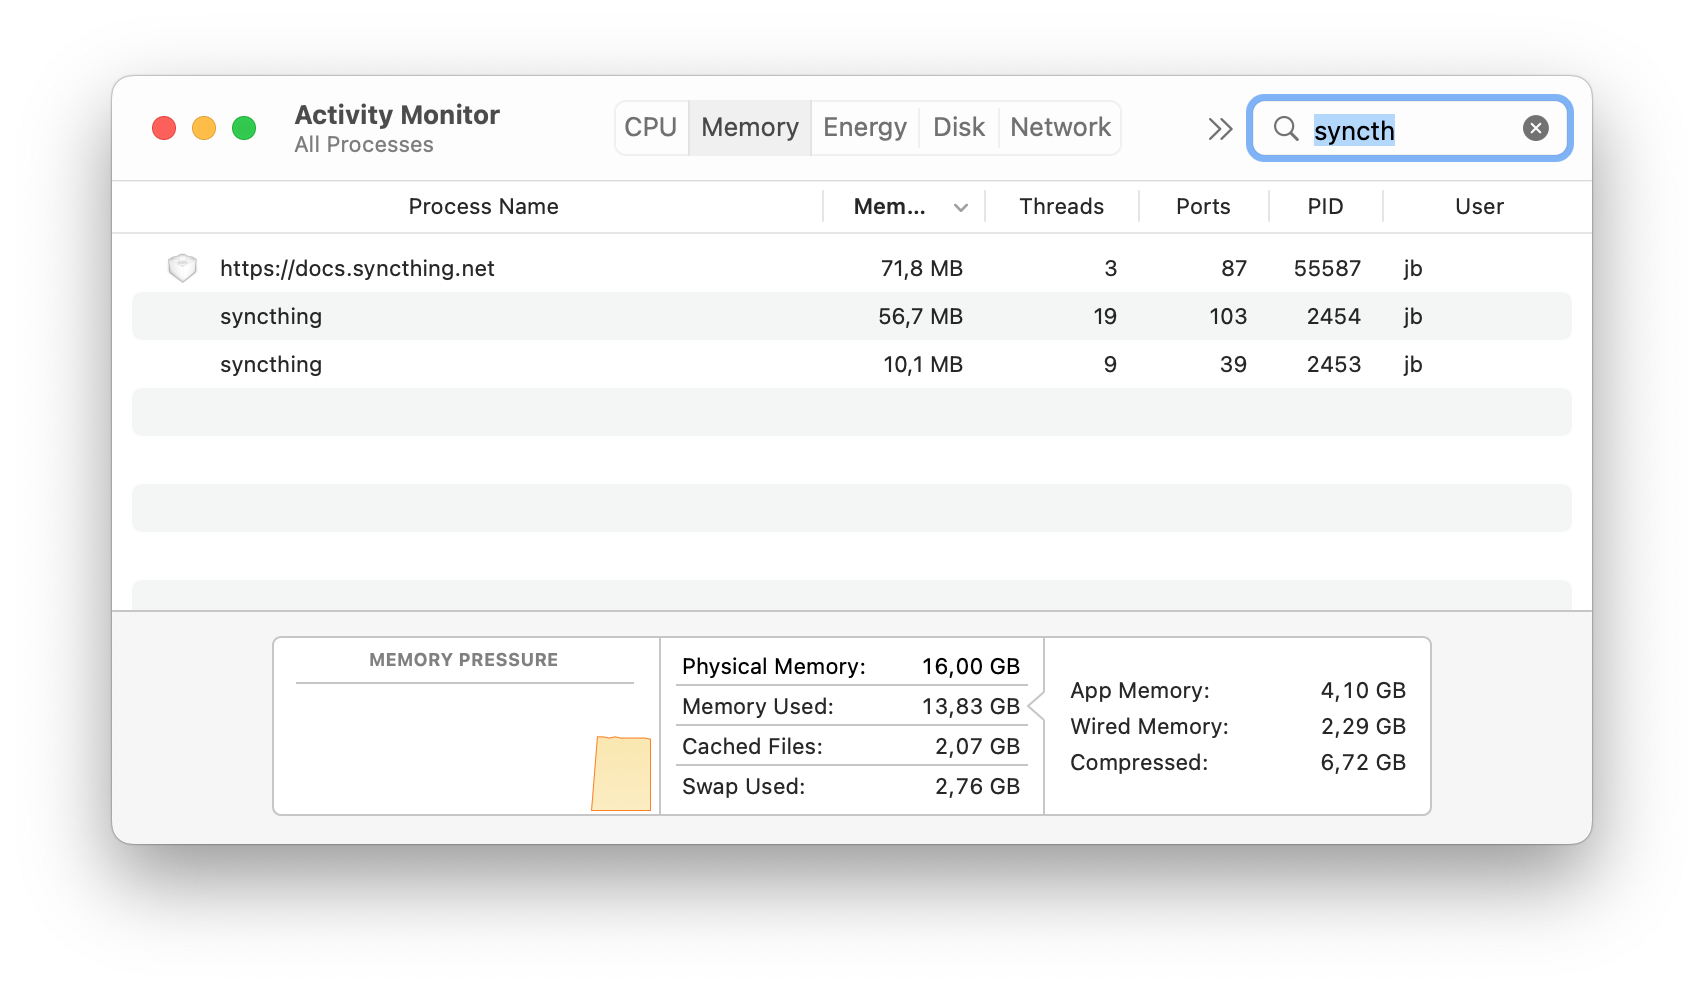
I run Syncthing on M1. Currently with just over a day's uptime, but it's at about 56 MiB resident, syncing 154 GiB of data.
@calmh Here are the profiles: syncthing-profiles.zip
Sorry if this isn't the right place to report this, @AudriusButkevicius
Had a look with pprof. Seems like a lot of memory is related to quic. Wonder if https://github.com/lucas-clemente/quic-go/issues/3322 is somehow related 🤔
I don't think we churn through streams, we have one per connection. I'm on the phone so can't check the profile to give any more meaningful insights.
It's a buffer pool for packets. So might be valid usage due to a lot of churn (seems overly excessive though), or quic-go failing to hand buffers back to the pool in some places. Can you get such profiles at different times to see if it continuously increases (which would align with the overall memory usage you see, but that might also have other causes).
I've had this issue as well. After a while, the memory usage grows 10x. Also, there's a constant 20-25% CPU usage. After restarting, it goes down to ~0.6%. Nothing is being synced and I don't see anything unusual in the logs.
@imsodin Just created a profile, about 4h later, saw an increase of 100MB since then: syncthing-heap-darwin-arm64-v1.19.1-003026.pprof.zip
Accompanied by a 30MB increase in that particalur pool in the profile.
Can you als grap goroutine traces please, to check if there's an unexpected amount of open streams or something - would be surprising but better be sure http://localhost:8384/debug/pprof/goroutine
The linked quic-go issue talks about not closing connections if I understand correctly. In our code it should be guaranteed that close is called, unless something is hung (which should then show in the traces from above).
@imsodin That URL doesn't work. I assume I need to restart with STPROFILER set, as per: https://docs.syncthing.net/branch/untrusted/html/dev/debugging.html
http://localhost:8384/debug/pprof/goroutine
The URL is http://localhost:9090/debug/pprof/goroutine actually 😉. STPROFILER does need to be enable beforehand though.
Okay, I will restart with the STPROFILER and report back in a few hours with a profile.
Not a go dev but the note about using io.ReadAll instead of io.ReadFull seems relevant?
https://github.com/lucas-clemente/quic-go/issues/3322#issuecomment-1023882246
Restarted, at 60MB. Will check back in the afternoon and download the goroutine!
Edit: I did step away from my work machine for the day, I will check back in tomorrow or monday at the latest with new profiles. Sorry y'all, real life interferred with opensource life 😉
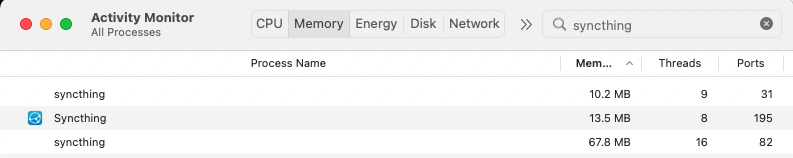
Sorry for the delay. I haven't been using the M1 Mac in a while, and so I am not seeing a lot memory usage right now (also a system update forced a restart 🙈 ). It went from 70 MB baseline to 140 MB. Here are the dumps: goroutine-check.zip. Will continue to monitor.
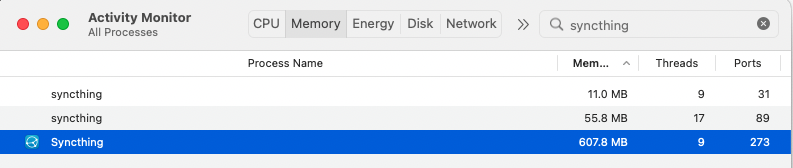
@calmh / @imsodin After a few more days, I am north of 450 MB memory again. Attached the profiles here: dumps_and_profiles.zip
Do you need more information or is this sufficient?
There's a ton of message writing routines. And a quic conn to be closed. Maybe the are contending or even dead-locking on something. @leipert Could you grap goroutines again with http://localhost:9090/debug/pprof/goroutine?debug=2
     35510   runtime.gopark
             runtime.goparkunlock (inline)
             runtime.semacquire1
             internal/poll.runtime_Semacquire
             internal/poll.(*fdMutex).rwlock
             internal/poll.(*FD).writeLock (inline)
             internal/poll.(*FD).WriteMsg
             net.(*netFD).writeMsg
             net.(*UDPConn).writeMsg
             net.(*UDPConn).WriteMsgUDP
             github.com/syncthing/syncthing/lib/stun.(*writeTrackingUdpConn).WriteMsgUDP
             github.com/AudriusButkevicius/pfilter.(*filteredConnObb).WriteMsgUDP
             github.com/lucas-clemente/quic-go.(*oobConn).WritePacket
             github.com/lucas-clemente/quic-go.(*baseServer).sendRetry
             github.com/lucas-clemente/quic-go.(*baseServer).handleInitialImpl.func1

         1   runtime.gopark
             runtime.chanrecv
             runtime.chanrecv1
             github.com/lucas-clemente/quic-go.(*session).CloseWithError
             github.com/syncthing/syncthing/lib/connections.(*quicTlsConn).Close
             github.com/syncthing/syncthing/lib/connections.internalConn.Close
             github.com/syncthing/syncthing/lib/protocol.(*rawConnection).internalClose.func1
             sync.(*Once).doSlow
             sync.(*Once).Do (inline)
             github.com/syncthing/syncthing/lib/protocol.(*rawConnection).internalClose
             github.com/syncthing/syncthing/lib/protocol.(*rawConnection).readerLoop
             github.com/syncthing/syncthing/lib/protocol.(*rawConnection).Start.func1
Looks like sending of Retry packets (https://github.com/lucas-clemente/quic-go/blob/332473668a992ce372c54c353b2bdc24344cf46e/server.go#L424-L436) is leading to a big backlog. Any idea why net.(*UDPConn).WriteMsgUDP would do that?
@imsodin: Here you go: goroutine_debug_2.zip
How do I open that file?
Got it, looks like they're actually stuck at WriteMsgUDP.
Now one change we could do in quic-go is to not spawn a separate Go routine for every retry, but only have a limited number of worker threads and discard Retries once they're all busy. But I'd prefer to understand why sending UDP packets is creating so much contention here.
They all try to write to the same *netFD protected by a lock which is held by one routine in iowait/netpoll since 1289min. No idea why it's blocked, but regardless a single write not going through shouldn't stall everything.
Goroutines formatted with panicparse: goroutine_debug_2-pp.txt
Thanks all for looking into this!
If it might help, I often switch between two networks (home and office). Maybe after waking from hibernation and/or between wired via Thunderbolt / wifi causes some weirdness. When I stayed at home for a few days, I didn't see the memory rise as dramatically.
@imsodin / @marten-seemann Unless you tell me otherwise I would restart the process regularly starting tomorrow as a mitigation, I am up to 900 MB again.
They all try to write to the same *netFD protected by a lock which is held by one routine in iowait/netpoll since 1289min
This sounds like a potential Go bug, to be honest. Really, there's not a lot that a QUIC implementation can reasonably do if sending a packet takes longer than 21h.
I think network operations can hang if you suspend the operating system at the wrong time, even if in theory they should not hang. Usually you combat that by setting a deadline.
The problem is all these operations are blocking, there's no way to pass a context/deadline to them. So even if the hang was detected, the goroutines would stick around.
Anyway a relevant problem in the current context is quic.Connection.CloseWithError blocking: It waits for sends to finish before returning, thus we never close the actual connection here. Maybe having a deadline there to unblock in quic would be appropriate (@marten-seemann ?). And we definitely can do that when closing the quic conn on our side: Wait 10s for the session to close, and if it doesn't go ahead closing everything else cutting our losses (leaving that on goroutine pending, but not accumulating further ones like it's happening here). Ugly, but less ugly than status quo.
Does WriteMsgUDP not respect write deadlines? It seems one should be set, to be able to fail with a timeout at some point. (Maybe internally in the quic package, maybe from our side if it's exposed.)
We had a similar issue way back with TLS/TCP connections because Close() does a write, and if we're closing because the connection is dead that will block forever. Setting a write deadline before close works.
That's actually it: Due to all the wrapping in quic conns, the deadline we set on the tls conn before closing is not applied to the underlying udp conn. And it's not as simple as just setting that deadline, as all quic connections from the listener share the underlying udp connection - we don't want to set a (very short) deadline for all quic connections when closing one.
One option would be to set a long timeout on the listener udp-conn (something in line with the ping timeout in the protocol). However there's no possibility to set a timeout, just deadlines - so we'd have to wrap the udp-conn to override all write methods to extend the deadline on every successful write. Very ugly.
Yeah... I'm not aware of any reasonable circumstances where an UDP write should block for an appreciable amount of time, really, so to me this feels like something that should happen in the QUIC package prior to each write. If the UDP write is still blocked after a minute or something, it feels safe to say that something bad has happened and that connection is dead...
Due to all the wrapping in quic conns
I remember vaguely that it was discussed at some point to abandon the current wrapping/pfilter approach and reimplement it as a handler for non-QUIC packets passed to quic-go.
Looking at the quic server code it would be doable to add a write timeout via net.PacketConn.SetWriteDeadline in the sendQueue, possibly configurable through the *Config parameter. @marten-seemann Does that approach seem sensible and if yes, would you welcome such a contribution?
I remember vaguely that it was discussed at some point to abandon the current wrapping/pfilter approach and reimplement it as a handler for non-QUIC packets passed to quic-go.
I don't remember these or know what it's abouth. However my "wrapping comment" wasn't correct, it plays a role butit isn't really the fundamental issue here. That's the difference between tcp and quic, where in the former we have one tcp conn per "syncthing connection", while for the latter it's a single udp conn with multiplexed "syncthing/quic connections" on top.
Looking at the quic server code it would be doable to add a write timeout via net.PacketConn.SetWriteDeadline in the sendQueue, possibly configurable through the *Config parameter. @marten-seemann Does that approach seem sensible and if yes, would you welcome such a contribution?
Not sure I understand how that's supposed to work. It's still the same underlying net.PacketConn, so the deadline would apply to all connections. I'd be very worried about the performance impact of setting a write deadline for every packet sent.
I'd like to raise the question again why we're not raising this problem with the Go team. This is a Go bug after all.
Not sure I understand how that's supposed to work. It's still the same underlying net.PacketConn, so the deadline would apply to all connections.
The deadline would indeed apply to all connections from one quic server/Listener with it's underlying connection. That seems like a desirable property, as all those connections are affected if the underlying connection is broken/timing out.
I'd be very worried about the performance impact of setting a write deadline for every packet sent.
That can be done more smartly than setting it on eery write, e.g. by setting a deadline and only extending it some time before it expires.
I'd like to raise the question again why we're not raising this problem with the Go team. This is a Go bug after all.
I don't understand this: Why is a blocking/hanging udp conn clearly a go bug (as in not an issue with the underlying system outside of go's control)?
@marten-seemann is this issue related to our problem here?
https://github.com/lucas-clemente/quic-go/issues/3409
Probably not. https://github.com/lucas-clemente/quic-go/issues/3409 would cause a connection to be dropped, but shouldn't result in a memory leak (unless your code doesn't properly deal with closed connections).