strimzi-kafka-operator
 strimzi-kafka-operator copied to clipboard
Fix/dashboards ds prometheus
Type of change
Select the type of your PR
- Bugfix
Description
When trying to add the Grafana dashboards programatically (via helm chart) this error appears:
Failed to upgrade legacy queries Datasource ${DS_PROMETHEUS} was not found
Seems it's related to this issue.
Checklist
Please go through this checklist and make sure all applicable tasks have been done
Tested on EKS. No visual changes done.
First if all: if I manually add the .json files to Grafana everything works fine..but I'm working on automatic the process of adding the dashboards as well. I'm using kube-prometheus-stack to deploy Prometheus/Grafana via Terraform+Terragrunt. Config looks like:
....
  values_dashboard_kafka = <<VALUES
grafana:
  dashboards:
    default:
      strimzi-kafka-exporter:
        url: https://raw.githubusercontent.com/strimzi/strimzi-kafka-operator/main/examples/metrics/grafana-dashboards/strimzi-kafka-exporter.json
      strimzi-zookeeper:
        url: https://raw.githubusercontent.com/strimzi/strimzi-kafka-operator/main/examples/metrics/grafana-dashboards/strimzi-zookeeper.json
      strimzi-kafka:
        url: https://raw.githubusercontent.com/strimzi/strimzi-kafka-operator/main/examples/metrics/grafana-dashboards/strimzi-kafka.json
VALUES
Then helm_release looks like:
resource "helm_release" "kube-prometheus-stack" {
  count                 = local.kube-prometheus-stack["enabled"] ? 1 : 0
  repository            = local.kube-prometheus-stack["repository"]
  name                  = local.kube-prometheus-stack["name"]
  chart                 = local.kube-prometheus-stack["chart"]
  version               = local.kube-prometheus-stack["chart_version"]
  timeout               = local.kube-prometheus-stack["timeout"]
  force_update          = local.kube-prometheus-stack["force_update"]
  recreate_pods         = local.kube-prometheus-stack["recreate_pods"]
  wait                  = local.kube-prometheus-stack["wait"]
  atomic                = local.kube-prometheus-stack["atomic"]
  cleanup_on_fail       = local.kube-prometheus-stack["cleanup_on_fail"]
  dependency_update     = local.kube-prometheus-stack["dependency_update"]
  disable_crd_hooks     = local.kube-prometheus-stack["disable_crd_hooks"]
  disable_webhooks      = local.kube-prometheus-stack["disable_webhooks"]
  render_subchart_notes = local.kube-prometheus-stack["render_subchart_notes"]
  replace               = local.kube-prometheus-stack["replace"]
  reset_values          = local.kube-prometheus-stack["reset_values"]
  reuse_values          = local.kube-prometheus-stack["reuse_values"]
  skip_crds             = local.kube-prometheus-stack["skip_crds"]
  verify                = local.kube-prometheus-stack["verify"]
  values = compact([
    local.values_kube-prometheus-stack,
    local.cert-manager["enabled"] ? local.values_dashboard_cert-manager : null,
    local.cluster-autoscaler["enabled"] ? local.values_dashboard_cluster-autoscaler : null,
    local.ingress-nginx["enabled"] ? local.values_dashboard_ingress-nginx : null,
    local.thanos["enabled"] ? local.values_dashboard_thanos : null,
    local.argo-cd["enabled"] ? local.values_dashboard_argo : null,
    local.strimzi["enabled"] ? local.values_dashboard_kafka : null,
    local.values_dashboard_node_exporter,
    local.kube-prometheus-stack["thanos_sidecar_enabled"] ? local.values_thanos_sidecar : null,
    local.kube-prometheus-stack["thanos_sidecar_enabled"] ? local.values_grafana_ds : null,
    local.kube-prometheus-stack["default_global_requests"] ? local.values_kps_global_requests : null,
    local.kube-prometheus-stack["default_global_limits"] ? local.values_kps_global_limits : null,
    local.kube-prometheus-stack["extra_values"]
  ])
  namespace = kubernetes_namespace.kube-prometheus-stack.*.metadata.0.name[count.index]

  depends_on = [
    helm_release.ingress-nginx,
    kubectl_manifest.prometheus-operator_crds
  ]
}
Ok, so once I deploy this..dashboards are also added automatically..but when I try to load them in the browser I get these errors from this image.

A lot of people complain about this with different other .json. PR contains workaround for this issue.
@scholzj - so, I should do these changes only in the packaging/examples directory and leave examples as is?
@scholzj - so, I should do these changes only in the packaging/examples directory and leave examples as is?
Yes, correct. The examples folder is updated only during a release.
A lot of people complain about this with different other .json. PR contains workaround for this issue.
Well, I'm not questioning that it fixes the issue for you. I'm questioning what it does to other users. That is why it would be good to understand what exactly you are adding and why is it the right way.
The dashabords for example have this today:
  "__inputs": [
    {
      "name": "DS_PROMETHEUS",
      "label": "Prometheus",
      "description": "",
      "type": "datasource",
      "pluginId": "prometheus",
      "pluginName": "Prometheus"
    }
  ]
How does it fit with it? It looks very similar.
PS: I use the Grafana Operator (https://operatorhub.io/operator/grafana-operator) which does nto seem to have any isssues to load the dashboards automatically.
I've pushed the changes to the packaging dir.
This guy had same issue as me: https://github.com/grafana-operator/grafana-operator/issues/75 It was solved on the operator ..probably that why it works for you.
Sorry, but I really think we need to understand what it does and why does it do it. When I load it as JSON, it adds the new input field which has some options which are IMHO unexpected -> with data sources which do not exist such as default. So it seems a bit weird.
@strimzi/maintainers Anyone understands Grafana enough to know what this actually does?
Tbh I don't know exactly what it does, I just noticed that the PR is reverting back the latest changes on the kafka exporter dashboard about showing N/A instead of 0 when no data are available. This is wrong.
This change adds a new variable that can be referenced in the dashboard json. It also adds a new filter field to the dashboard in grafana:

For example, here we added cluster to be able to pick between different datasources. I remember, that we had to remove the whole _input and datasource parts when we started syncing dashboards via Argo (we basically used default datasource).
Edit: I did basically the same today in https://github.com/ExcelentProject/sokar/pull/37/ so from my POV it's a good idea to add it.
So I tried to also add it manually to Grafana and it's really weird because I as a user had to specify datasource and the new field kinda doesn't have any value because it doesn't change anything.
I was able to import it automatically with GrafanaDashboard, but again, if the user doesn't expect to load Strimzi metrics from multiple datasources and switch between them in the dashboard, it looks weird as well.
@giany have you tried to specify DS_PROMETHEUS value through chart configuration? There is an option to specify datasource name in Grafana chart so I would expect it should work even with our current version of dashboards.
I think this is relevant to the conversation: https://github.com/grafana/grafana/issues/10786
Well, the issue still exists. We are using the kube-prometheus-stack and adding the .json to our deployment via ConfigMap leads to the same error:
Failed to upgrade legacy queries Datasource ${DS_PROMETHEUS} was not found
ConfigMap
apiVersion: v1
kind: ConfigMap
metadata:
name: strimzi-kafka
namespace: xxx
labels:
app.kubernetes.io/name: prometheus-operator-grafana
app.kubernetes.io/component: grafana
grafana_dashboard: "1"
annotations:
k8s-sidecar-target-directory: "/tmp/dashboards/k8"
data:
strimzi-kafka.json: |
{
"__inputs": [
{
"name": "DS_PROMETHEUS",
"label": "Prometheus",
"description": "",
"type": "datasource",
"pluginId": "prometheus",
"pluginName": "Prometheus"
}
],
"__requires": [
{
"type": "grafana",
"id": "grafana",
"name": "Grafana",
"version": "7.3.7"
},
{
"type": "panel",
"id": "graph",
"name": "Graph",
"version": "5.0.0"
},
{
"type": "datasource",
"id": "prometheus",
"name": "Prometheus",
"version": "5.0.0"
},
{
"type": "panel",
"id": "singlestat",
"name": "Singlestat",
"version": "5.0.0"
}
],
"annotations": {
"list": [
{
"builtIn": 1,
"datasource": "-- Grafana --",
"enable": true,
"hide": true,
"iconColor": "rgba(0, 211, 255, 1)",
"name": "Annotations & Alerts",
"type": "dashboard"
}
]
},
"editable": true,
"gnetId": null,
"graphTooltip": 0,
"iteration": 1600633283203,
"links": [],
"panels": [
{
"cacheTimeout": null,
"colorBackground": false,
"colorValue": true,
"colors": [
"#d44a3a",
"rgba(237, 129, 40, 0.89)",
"#299c46"
],
"datasource": "${DS_PROMETHEUS}",
"description": "Number of brokers online",
"format": "none",
"gauge": {
"maxValue": 100,
"minValue": 0,
"show": false,
"thresholdLabels": false,
"thresholdMarkers": true
},
"gridPos": {
"h": 4,
"w": 3,
"x": 0,
"y": 0
},
"id": 46,
"interval": null,
"links": [],
"mappingType": 1,
"mappingTypes": [
{
"name": "value to text",
"value": 1
},
{
"name": "range to text",
"value": 2
}
],
"maxDataPoints": 100,
"nullPointMode": "connected",
"nullText": null,
"postfix": "",
"postfixFontSize": "50%",
"prefix": "",
"prefixFontSize": "50%",
"rangeMaps": [
{
"from": "null",
"text": "N/A",
"to": "null"
}
],
"repeat": null,
"repeatDirection": "h",
"sparkline": {
"fillColor": "rgba(31, 118, 189, 0.18)",
"full": false,
"lineColor": "rgb(31, 120, 193)",
"show": false
},
"tableColumn": "",
"targets": [
{
"expr": "count(kafka_server_replicamanager_leadercount{namespace=\"$kubernetes_namespace\",strimzi_io_cluster=\"$strimzi_cluster_name\"})",
"format": "time_series",
"hide": false,
"intervalFactor": 1,
"legendFormat": "",
"refId": "A"
}
],
"thresholds": "0,2",
"title": "Brokers Online",
"type": "singlestat",
"valueFontSize": "200%",
"valueMaps": [
{
"op": "=",
"text": "N/A",
"value": "null"
}
],
"valueName": "current"
},
{
"cacheTimeout": null,
"colorBackground": false,
"colorValue": true,
"colors": [
"#299c46",
"#e5ac0e",
"#bf1b00"
],
"datasource": "${DS_PROMETHEUS}",
"description": "Number of active controllers in the cluster",
"format": "none",
"gauge": {
"maxValue": 100,
"minValue": 0,
"show": false,
"thresholdLabels": false,
"thresholdMarkers": true
},
"gridPos": {
"h": 4,
"w": 3,
"x": 3,
"y": 0
},
"id": 36,
"interval": null,
"links": [],
"mappingType": 1,
"mappingTypes": [
{
"name": "value to text",
"value": 1
},
{
"name": "range to text",
"value": 2
}
],
"maxDataPoints": 100,
"nullPointMode": "connected",
"nullText": null,
"postfix": "",
"postfixFontSize": "50%",
"prefix": "",
"prefixFontSize": "50%",
"rangeMaps": [
{
"from": "null",
"text": "N/A",
"to": "null"
}
],
"sparkline": {
"fillColor": "rgba(31, 118, 189, 0.18)",
"full": false,
"lineColor": "rgb(31, 120, 193)",
"show": false
},
"tableColumn": "",
"targets": [
{
"expr": "sum(kafka_controller_kafkacontroller_activecontrollercount{namespace=\"$kubernetes_namespace\",strimzi_io_cluster=\"$strimzi_cluster_name\"})",
"format": "time_series",
"hide": false,
"intervalFactor": 1,
"refId": "A"
}
],
"thresholds": "2",
"title": "Active Controllers",
"type": "singlestat",
"valueFontSize": "200%",
"valueMaps": [
{
"op": "=",
"text": "N/A",
"value": "null"
}
],
"valueName": "current"
},
{
"cacheTimeout": null,
"colorBackground": false,
"colorValue": true,
"colors": [
"#299c46",
"rgba(237, 129, 40, 0.89)",
"#d44a3a"
],
"datasource": "${DS_PROMETHEUS}",
"description": "Unclean leader election rate",
"format": "none",
"gauge": {
"maxValue": 100,
"minValue": 0,
"show": false,
"thresholdLabels": false,
"thresholdMarkers": true
},
"gridPos": {
"h": 4,
"w": 3,
"x": 6,
"y": 0
},
"id": 38,
"interval": null,
"links": [],
"mappingType": 1,
"mappingTypes": [
{
"name": "value to text",
"value": 1
},
{
"name": "range to text",
"value": 2
}
],
"maxDataPoints": 100,
"nullPointMode": "connected",
"nullText": null,
"postfix": "",
"postfixFontSize": "50%",
"prefix": "",
"prefixFontSize": "50%",
"rangeMaps": [
{
"from": "null",
"text": "N/A",
"to": "null"
}
],
"sparkline": {
"fillColor": "rgba(31, 118, 189, 0.18)",
"full": false,
"lineColor": "rgb(31, 120, 193)",
"show": false
},
"tableColumn": "",
"targets": [
{
"expr": "sum(irate(kafka_controller_controllerstats_uncleanleaderelections_total{namespace=\"$kubernetes_namespace\",strimzi_io_cluster=\"$strimzi_cluster_name\"}[5m]))",
"format": "time_series",
"hide": false,
"intervalFactor": 1,
"refId": "A"
}
],
"thresholds": "2",
"title": "Unclean Leader Election Rate",
"type": "singlestat",
"valueFontSize": "200%",
"valueMaps": [
{
"op": "=",
"text": "N/A",
"value": "null"
}
],
"valueName": "current"
},
{
"cacheTimeout": null,
"colorBackground": false,
"colorValue": true,
"colors": [
"#d44a3a",
"rgba(237, 129, 40, 0.89)",
"#299c46"
],
"datasource": "${DS_PROMETHEUS}",
"description": "Replicas that are online",
"format": "none",
"gauge": {
"maxValue": 100,
"minValue": 0,
"show": false,
"thresholdLabels": false,
"thresholdMarkers": true
},
"gridPos": {
"h": 4,
"w": 3,
"x": 9,
"y": 0
},
"id": 40,
"interval": null,
"links": [],
"mappingType": 1,
"mappingTypes": [
{
"name": "value to text",
"value": 1
},
{
"name": "range to text",
"value": 2
}
],
"maxDataPoints": 100,
"nullPointMode": "connected",
"nullText": null,
"postfix": "",
"postfixFontSize": "50%",
"prefix": "",
"prefixFontSize": "50%",
"rangeMaps": [
{
"from": "null",
"text": "N/A",
"to": "null"
}
],
"sparkline": {
"fillColor": "rgba(31, 118, 189, 0.18)",
"full": false,
"lineColor": "rgb(31, 120, 193)",
"show": false
},
"tableColumn": "",
"targets": [
{
"expr": "sum(kafka_server_replicamanager_partitioncount{namespace=\"$kubernetes_namespace\",strimzi_io_cluster=\"$strimzi_cluster_name\"})",
"format": "time_series",
"intervalFactor": 1,
"refId": "A"
}
],
"thresholds": "0,0",
"title": "Online Replicas",
"type": "singlestat",
"valueFontSize": "200%",
"valueMaps": [
{
"op": "=",
"text": "N/A",
"value": "null"
}
],
"valueName": "current"
},
{
"cacheTimeout": null,
"colorBackground": false,
"colorValue": true,
"colors": [
"#508642",
"rgba(237, 129, 40, 0.89)",
"#bf1b00"
],
"datasource": "${DS_PROMETHEUS}",
"description": "Number of under-replicated partitions (| ISR | < | all replicas |).",
"format": "none",
"gauge": {
"maxValue": 100,
"minValue": 0,
"show": false,
"thresholdLabels": false,
"thresholdMarkers": true
},
"gridPos": {
"h": 4,
"w": 3,
"x": 12,
"y": 0
},
"id": 30,
"interval": null,
"links": [],
"mappingType": 1,
"mappingTypes": [
{
"name": "value to text",
"value": 1
},
{
"name": "range to text",
"value": 2
}
],
"maxDataPoints": 100,
"nullPointMode": "connected",
"nullText": null,
"postfix": "",
"postfixFontSize": "50%",
"prefix": "",
"prefixFontSize": "100%",
"rangeMaps": [
{
"from": "null",
"text": "N/A",
"to": "null"
}
],
"sparkline": {
"fillColor": "rgba(31, 118, 189, 0.18)",
"full": false,
"lineColor": "rgb(31, 120, 193)",
"show": false
},
"tableColumn": "",
"targets": [
{
"expr": "sum(kafka_server_replicamanager_underreplicatedpartitions{namespace=\"$kubernetes_namespace\",strimzi_io_cluster=\"$strimzi_cluster_name\"})",
"format": "time_series",
"hide": false,
"intervalFactor": 2,
"refId": "A"
}
],
"thresholds": "1,5",
"title": "Under Replicated Partitions",
"type": "singlestat",
"valueFontSize": "200%",
"valueMaps": [
{
"op": "=",
"text": "N/A",
"value": "null"
}
],
"valueName": "current"
},
{
"cacheTimeout": null,
"colorBackground": false,
"colorValue": true,
"colors": [
"#508642",
"#ef843c",
"#bf1b00"
],
"datasource": "${DS_PROMETHEUS}",
"description": "Number of partitions which are at their minimum in sync replica count (| ISR | == | min.insync.replicas |)",
"format": "none",
"gauge": {
"maxValue": 100,
"minValue": 0,
"show": false,
"thresholdLabels": false,
"thresholdMarkers": true
},
"gridPos": {
"h": 4,
"w": 3,
"x": 15,
"y": 0
},
"id": 102,
"interval": null,
"links": [],
"mappingType": 1,
"mappingTypes": [
{
"name": "value to text",
"value": 1
},
{
"name": "range to text",
"value": 2
}
],
"maxDataPoints": 100,
"nullPointMode": "connected",
"nullText": null,
"postfix": "",
"postfixFontSize": "50%",
"prefix": "",
"prefixFontSize": "100%",
"rangeMaps": [
{
"from": "null",
"text": "N/A",
"to": "null"
}
],
"sparkline": {
"fillColor": "rgba(31, 118, 189, 0.18)",
"full": false,
"lineColor": "rgb(31, 120, 193)",
"show": false
},
"tableColumn": "",
"targets": [
{
"expr": "sum(kafka_cluster_partition_atminisr{namespace=\"$kubernetes_namespace\",strimzi_io_cluster=\"$strimzi_cluster_name\"})",
"format": "time_series",
"hide": false,
"intervalFactor": 2,
"refId": "A"
}
],
"thresholds": "1,5",
"title": "Partitions at minimum ISR",
"type": "singlestat",
"valueFontSize": "200%",
"valueMaps": [
{
"op": "=",
"text": "0",
"value": "null"
}
],
"valueName": "current"
},
{
"cacheTimeout": null,
"colorBackground": false,
"colorValue": true,
"colors": [
"#508642",
"#ef843c",
"#bf1b00"
],
"datasource": "${DS_PROMETHEUS}",
"description": "Number of partitions which are under their minimum in sync replica count (| ISR | < | min.insync.replicas |)",
"format": "none",
"gauge": {
"maxValue": 100,
"minValue": 0,
"show": false,
"thresholdLabels": false,
"thresholdMarkers": true
},
"gridPos": {
"h": 4,
"w": 3,
"x": 18,
"y": 0
},
"id": 103,
"interval": null,
"links": [],
"mappingType": 1,
"mappingTypes": [
{
"name": "value to text",
"value": 1
},
{
"name": "range to text",
"value": 2
}
],
"maxDataPoints": 100,
"nullPointMode": "connected",
"nullText": null,
"postfix": "",
"postfixFontSize": "50%",
"prefix": "",
"prefixFontSize": "100%",
"rangeMaps": [
{
"from": "null",
"text": "N/A",
"to": "null"
}
],
"sparkline": {
"fillColor": "rgba(31, 118, 189, 0.18)",
"full": false,
"lineColor": "rgb(31, 120, 193)",
"show": false
},
"tableColumn": "",
"targets": [
{
"expr": "sum(kafka_cluster_partition_underminisr{namespace=\"$kubernetes_namespace\",strimzi_io_cluster=\"$strimzi_cluster_name\"})",
"format": "time_series",
"hide": false,
"intervalFactor": 2,
"refId": "A"
}
],
"thresholds": "1,1",
"title": "Partitions under minimum ISR",
"type": "singlestat",
"valueFontSize": "200%",
"valueMaps": [
{
"op": "=",
"text": "0",
"value": "null"
}
],
"valueName": "current"
},
{
"cacheTimeout": null,
"colorBackground": false,
"colorValue": true,
"colors": [
"#508642",
"#ef843c",
"#bf1b00"
],
"datasource": "${DS_PROMETHEUS}",
"description": "Number of partitions that don’t have an active leader and are hence not writable or readable",
"format": "none",
"gauge": {
"maxValue": 100,
"minValue": 0,
"show": false,
"thresholdLabels": false,
"thresholdMarkers": true
},
"gridPos": {
"h": 4,
"w": 3,
"x": 21,
"y": 0
},
"id": 32,
"interval": null,
"links": [],
"mappingType": 1,
"mappingTypes": [
{
"name": "value to text",
"value": 1
},
{
"name": "range to text",
"value": 2
}
],
"maxDataPoints": 100,
"nullPointMode": "connected",
"nullText": null,
"postfix": "",
"postfixFontSize": "50%",
"prefix": "",
"prefixFontSize": "50%",
"rangeMaps": [
{
"from": "null",
"text": "N/A",
"to": "null"
}
],
"sparkline": {
"fillColor": "rgba(31, 118, 189, 0.18)",
"full": false,
"lineColor": "rgb(31, 120, 193)",
"show": false
},
"tableColumn": "",
"targets": [
{
"expr": "sum(kafka_controller_kafkacontroller_offlinepartitionscount{namespace=\"$kubernetes_namespace\",strimzi_io_cluster=\"$strimzi_cluster_name\"})",
"format": "time_series",
"hide": false,
"intervalFactor": 1,
"refId": "A"
}
],
"thresholds": "1,1",
"title": "Offline Partitions Count",
"type": "singlestat",
"valueFontSize": "200%",
"valueMaps": [
{
"op": "=",
"text": "N/A",
"value": "null"
}
],
"valueName": "current"
},
{
"collapsed": false,
"gridPos": {
"h": 1,
"w": 24,
"x": 0,
"y": 4
},
"id": 28,
"panels": [],
"title": "Kafka",
"type": "row"
},
{
"aliasColors": {},
"bars": false,
"dashLength": 10,
"dashes": false,
"datasource": "${DS_PROMETHEUS}",
"description": "Kafka broker pods memory usage",
"fill": 1,
"gridPos": {
"h": 7,
"w": 6,
"x": 0,
"y": 5
},
"id": 82,
"legend": {
"avg": false,
"current": false,
"max": false,
"min": false,
"show": true,
"total": false,
"values": false
},
"lines": true,
"linewidth": 1,
"links": [],
"nullPointMode": "null",
"paceLength": 10,
"percentage": false,
"pointradius": 5,
"points": false,
"renderer": "flot",
"seriesOverrides": [],
"spaceLength": 10,
"stack": false,
"steppedLine": false,
"targets": [
{
"expr": "sum(container_memory_usage_bytes{namespace=\"$kubernetes_namespace\",pod=~\"$strimzi_cluster_name-$kafka_broker\",container=\"kafka\"}) by (pod)",
"format": "time_series",
"hide": false,
"intervalFactor": 1,
"legendFormat": "{{pod}}",
"refId": "A"
}
],
"thresholds": [],
"timeFrom": null,
"timeRegions": [],
"timeShift": null,
"title": "Memory Usage",
"tooltip": {
"shared": true,
"sort": 0,
"value_type": "individual"
},
"type": "graph",
"xaxis": {
"buckets": null,
"mode": "time",
"name": null,
"show": true,
"values": []
},
"yaxes": [
{
"format": "bytes",
"label": null,
"logBase": 1,
"max": null,
"min": null,
"show": true
},
{
"format": "short",
"label": null,
"logBase": 1,
"max": null,
"min": null,
"show": true
}
],
"yaxis": {
"align": false,
"alignLevel": null
}
},
{
"aliasColors": {},
"bars": false,
"dashLength": 10,
"dashes": false,
"datasource": "${DS_PROMETHEUS}",
"description": "Aggregated Kafka broker pods CPU usage",
"fill": 1,
"gridPos": {
"h": 7,
"w": 6,
"x": 6,
"y": 5
},
"id": 81,
"legend": {
"avg": false,
"current": false,
"max": false,
"min": false,
"show": true,
"total": false,
"values": false
},
"lines": true,
"linewidth": 1,
"links": [],
"nullPointMode": "null",
"paceLength": 10,
"percentage": false,
"pointradius": 5,
"points": false,
"renderer": "flot",
"seriesOverrides": [],
"spaceLength": 10,
"stack": false,
"steppedLine": false,
"targets": [
{
"expr": "sum(rate(container_cpu_usage_seconds_total{namespace=\"$kubernetes_namespace\",pod=~\"$strimzi_cluster_name-$kafka_broker\",container=\"kafka\"}[5m])) by (pod)",
"format": "time_series",
"hide": false,
"intervalFactor": 1,
"legendFormat": "{{pod}}",
"refId": "A"
}
],
"thresholds": [],
"timeFrom": null,
"timeRegions": [],
"timeShift": null,
"title": "CPU Usage",
"tooltip": {
"shared": true,
"sort": 0,
"value_type": "individual"
},
"type": "graph",
"xaxis": {
"buckets": null,
"mode": "time",
"name": null,
"show": true,
"values": []
},
"yaxes": [
{
"format": "short",
"label": null,
"logBase": 1,
"max": null,
"min": null,
"show": true
},
{
"format": "short",
"label": null,
"logBase": 1,
"max": null,
"min": null,
"show": true
}
],
"yaxis": {
"align": false,
"alignLevel": null
}
},
{
"aliasColors": {},
"bars": false,
"dashLength": 10,
"dashes": false,
"datasource": "${DS_PROMETHEUS}",
"description": "Kafka broker pods disk usage",
"fill": 1,
"gridPos": {
"h": 7,
"w": 6,
"x": 12,
"y": 5
},
"id": 83,
"legend": {
"avg": false,
"current": false,
"max": false,
"min": false,
"show": true,
"total": false,
"values": false
},
"lines": true,
"linewidth": 1,
"links": [],
"nullPointMode": "null",
"paceLength": 10,
"percentage": false,
"pointradius": 5,
"points": false,
"renderer": "flot",
"seriesOverrides": [],
"spaceLength": 10,
"stack": false,
"steppedLine": false,
"targets": [
{
"expr": "sum(kubelet_volume_stats_available_bytes{namespace=\"$kubernetes_namespace\",persistentvolumeclaim=~\"data(-[0-9]+)?-$strimzi_cluster_name-kafka-[0-9]+\"}) by (persistentvolumeclaim)",
"format": "time_series",
"hide": false,
"intervalFactor": 1,
"legendFormat": "{{persistentvolumeclaim}}",
"refId": "A"
}
],
"thresholds": [],
"timeFrom": null,
"timeRegions": [],
"timeShift": null,
"title": "Available Disk Space",
"tooltip": {
"shared": true,
"sort": 0,
"value_type": "individual"
},
"type": "graph",
"xaxis": {
"buckets": null,
"mode": "time",
"name": null,
"show": true,
"values": []
},
"yaxes": [
{
"format": "bytes",
"label": null,
"logBase": 1,
"max": null,
"min": null,
"show": true
},
{
"format": "short",
"label": null,
"logBase": 1,
"max": null,
"min": null,
"show": true
}
],
"yaxis": {
"align": false,
"alignLevel": null
}
},
{
"aliasColors": {},
"bars": false,
"dashLength": 10,
"dashes": false,
"datasource": "${DS_PROMETHEUS}",
"description": "Open File Descriptors",
"fill": 1,
"gridPos": {
"h": 7,
"w": 6,
"x": 18,
"y": 5
},
"id": 107,
"legend": {
"avg": false,
"current": false,
"max": false,
"min": false,
"show": true,
"total": false,
"values": false
},
"lines": true,
"linewidth": 1,
"links": [],
"nullPointMode": "null",
"paceLength": 10,
"percentage": false,
"pointradius": 5,
"points": false,
"renderer": "flot",
"seriesOverrides": [],
"spaceLength": 10,
"stack": false,
"steppedLine": false,
"targets": [
{
"expr": "sum(process_open_fds{namespace=\"$kubernetes_namespace\",kubernetes_pod_name=~\"$strimzi_cluster_name-$kafka_broker\",container=\"kafka\"}) by (kubernetes_pod_name)",
"format": "time_series",
"hide": false,
"intervalFactor": 1,
"legendFormat": "{{kubernetes_pod_name}}",
"refId": "A"
}
],
"thresholds": [],
"timeFrom": null,
"timeRegions": [],
"timeShift": null,
"title": "Open File Descriptors",
"tooltip": {
"shared": true,
"sort": 0,
"value_type": "individual"
},
"type": "graph",
"xaxis": {
"buckets": null,
"mode": "time",
"name": null,
"show": true,
"values": []
},
"yaxes": [
{
"format": "none",
"label": null,
"logBase": 1,
"max": null,
"min": null,
"show": true
},
{
"format": "short",
"label": null,
"logBase": 1,
"max": null,
"min": null,
"show": true
}
],
"yaxis": {
"align": false,
"alignLevel": null
}
},
{
"aliasColors": {},
"bars": false,
"dashLength": 10,
"dashes": false,
"datasource": "${DS_PROMETHEUS}",
"fill": 1,
"gridPos": {
"h": 7,
"w": 6,
"x": 0,
"y": 12
},
"id": 93,
"legend": {
"avg": false,
"current": false,
"max": false,
"min": false,
"show": true,
"total": false,
"values": false
},
"lines": true,
"linewidth": 1,
"links": [],
"nullPointMode": "null",
"paceLength": 10,
"percentage": false,
"pointradius": 5,
"points": false,
"renderer": "flot",
"seriesOverrides": [],
"spaceLength": 10,
"stack": false,
"steppedLine": false,
"targets": [
{
"expr": "sum(jvm_memory_bytes_used{namespace=\"$kubernetes_namespace\",kubernetes_pod_name=~\"$strimzi_cluster_name-$kafka_broker\",strimzi_io_name=\"$strimzi_cluster_name-kafka\"}) by (kubernetes_pod_name)",
"format": "time_series",
"intervalFactor": 1,
"legendFormat": "{{kubernetes_pod_name}}",
"refId": "A"
}
],
"thresholds": [],
"timeFrom": null,
"timeRegions": [],
"timeShift": null,
"title": "JVM Memory Used",
"tooltip": {
"shared": true,
"sort": 0,
"value_type": "individual"
},
"type": "graph",
"xaxis": {
"buckets": null,
"mode": "time",
"name": null,
"show": true,
"values": []
},
"yaxes": [
{
"format": "decbytes",
"label": null,
"logBase": 1,
"max": null,
"min": null,
"show": true
},
{
"format": "short",
"label": null,
"logBase": 1,
"max": null,
"min": null,
"show": true
}
],
"yaxis": {
"align": false,
"alignLevel": null
}
},
{
"aliasColors": {},
"bars": false,
"dashLength": 10,
"dashes": false,
"datasource": "${DS_PROMETHEUS}",
"fill": 1,
"gridPos": {
"h": 7,
"w": 6,
"x": 6,
"y": 12
},
"id": 95,
"legend": {
"avg": false,
"current": false,
"max": false,
"min": false,
"show": true,
"total": false,
"values": false
},
"lines": true,
"linewidth": 1,
"links": [],
"nullPointMode": "null",
"paceLength": 10,
"percentage": false,
"pointradius": 5,
"points": false,
"renderer": "flot",
"seriesOverrides": [],
"spaceLength": 10,
"stack": false,
"steppedLine": false,
"targets": [
{
"expr": "sum(rate(jvm_gc_collection_seconds_sum{namespace=\"$kubernetes_namespace\",kubernetes_pod_name=~\"$strimzi_cluster_name-$kafka_broker\",strimzi_io_name=\"$strimzi_cluster_name-kafka\"}[5m])) by (kubernetes_pod_name)",
"format": "time_series",
"intervalFactor": 1,
"legendFormat": "{{kubernetes_pod_name}}",
"refId": "A"
}
],
"thresholds": [],
"timeFrom": null,
"timeRegions": [],
"timeShift": null,
"title": "JVM GC Time",
"tooltip": {
"shared": true,
"sort": 0,
"value_type": "individual"
},
"type": "graph",
"xaxis": {
"buckets": null,
"mode": "time",
"name": null,
"show": true,
"values": []
},
"yaxes": [
{
"format": "ms",
"label": null,
"logBase": 1,
"max": null,
"min": null,
"show": true
},
{
"format": "short",
"label": null,
"logBase": 1,
"max": null,
"min": null,
"show": true
}
],
"yaxis": {
"align": false,
"alignLevel": null
}
},
{
"aliasColors": {},
"bars": false,
"dashLength": 10,
"dashes": false,
"datasource": "${DS_PROMETHEUS}",
"fill": 1,
"gridPos": {
"h": 7,
"w": 6,
"x": 12,
"y": 12
},
"id": 97,
"legend": {
"avg": false,
"current": false,
"max": false,
"min": false,
"show": true,
"total": false,
"values": false
},
"lines": true,
"linewidth": 1,
"links": [],
"nullPointMode": "null",
"paceLength": 10,
"percentage": false,
"pointradius": 5,
"points": false,
"renderer": "flot",
"seriesOverrides": [],
"spaceLength": 10,
"stack": false,
"steppedLine": false,
"targets": [
{
"expr": "sum(rate(jvm_gc_collection_seconds_count{namespace=\"$kubernetes_namespace\",kubernetes_pod_name=~\"$strimzi_cluster_name-$kafka_broker\",strimzi_io_name=\"$strimzi_cluster_name-kafka\"}[5m])) by (kubernetes_pod_name)",
"format": "time_series",
"intervalFactor": 1,
"legendFormat": "{{kubernetes_pod_name}}",
"refId": "A"
}
],
"thresholds": [],
"timeFrom": null,
"timeRegions": [],
"timeShift": null,
"title": "JVM GC Count",
"tooltip": {
"shared": true,
"sort": 0,
"value_type": "individual"
},
"type": "graph",
"xaxis": {
"buckets": null,
"mode": "time",
"name": null,
"show": true,
"values": []
},
"yaxes": [
{
"format": "short",
"label": null,
"logBase": 1,
"max": null,
"min": null,
"show": true
},
{
"format": "short",
"label": null,
"logBase": 1,
"max": null,
"min": null,
"show": true
}
],
"yaxis": {
"align": false,
"alignLevel": null
}
},
{
"aliasColors": {},
"bars": false,
"dashLength": 10,
"dashes": false,
"datasource": "${DS_PROMETHEUS}",
"description": "JVM thread count",
"fill": 1,
"gridPos": {
"h": 7,
"w": 6,
"x": 18,
"y": 12
},
"id": 108,
"legend": {
"avg": false,
"current": false,
"max": false,
"min": false,
"show": true,
"total": false,
"values": false
},
"lines": true,
"linewidth": 1,
"links": [],
"nullPointMode": "null",
"paceLength": 10,
"percentage": false,
"pointradius": 5,
"points": false,
"renderer": "flot",
"seriesOverrides": [],
"spaceLength": 10,
"stack": false,
"steppedLine": false,
"targets": [
{
"expr": "sum(jvm_threads_current{namespace=\"$kubernetes_namespace\",kubernetes_pod_name=~\"$strimzi_cluster_name-$kafka_broker\",strimzi_io_name=\"$strimzi_cluster_name-kafka\"}) by (kubernetes_pod_name)",
"format": "time_series",
"intervalFactor": 1,
"legendFormat": "{{kubernetes_pod_name}}",
"refId": "A"
}
],
"thresholds": [],
"timeFrom": null,
"timeRegions": [],
"timeShift": null,
"title": "JVM Thread Count",
"tooltip": {
"shared": true,
"sort": 0,
"value_type": "individual"
},
"type": "graph",
"xaxis": {
"buckets": null,
"mode": "time",
"name": null,
"show": true,
"values": []
},
"yaxes": [
{
"format": "short",
"label": null,
"logBase": 1,
"max": null,
"min": null,
"show": true
},
{
"format": "short",
"label": null,
"logBase": 1,
"max": null,
"min": null,
"show": true
}
],
"yaxis": {
"align": false,
"alignLevel": null
}
},
{
"cacheTimeout": null,
"colorBackground": false,
"colorValue": true,
"colors": [
"#d44a3a",
"rgba(237, 129, 40, 0.89)",
"#299c46"
],
"datasource": "${DS_PROMETHEUS}",
"description": "Total incoming byte rate",
"format": "Bps",
"gauge": {
"maxValue": 100,
"minValue": 0,
"show": false,
"thresholdLabels": false,
"thresholdMarkers": true
},
"gridPos": {
"h": 4,
"w": 6,
"x": 0,
"y": 19
},
"id": 98,
"interval": null,
"links": [],
"mappingType": 1,
"mappingTypes": [
{
"name": "value to text",
"value": 1
},
{
"name": "range to text",
"value": 2
}
],
"maxDataPoints": 100,
"nullPointMode": "connected",
"nullText": null,
"postfix": "",
"postfixFontSize": "50%",
"prefix": "",
"prefixFontSize": "50%",
"rangeMaps": [
{
"from": "null",
"text": "0",
"to": "null"
}
],
"repeatDirection": "h",
"sparkline": {
"fillColor": "rgba(31, 118, 189, 0.18)",
"full": false,
"lineColor": "rgb(31, 120, 193)",
"show": false
},
"tableColumn": "",
"targets": [
{
"expr": "sum(irate(kafka_server_brokertopicmetrics_bytesin_total{namespace=\"$kubernetes_namespace\",strimzi_io_cluster=\"$strimzi_cluster_name\",topic=~\"$kafka_topic\",topic!=\"\",kubernetes_pod_name=~\"$strimzi_cluster_name-$kafka_broker\"}[1m]))",
"format": "time_series",
"hide": false,
"intervalFactor": 1,
"legendFormat": "",
"refId": "A"
}
],
"thresholds": "0,2",
"title": "Total Incoming Byte Rate",
"type": "singlestat",
"valueFontSize": "200%",
"valueMaps": [
{
"op": "=",
"text": "0",
"value": "null"
}
],
"valueName": "current"
},
{
"cacheTimeout": null,
"colorBackground": false,
"colorValue": true,
"colors": [
"#d44a3a",
"rgba(237, 129, 40, 0.89)",
"#299c46"
],
"datasource": "${DS_PROMETHEUS}",
"description": "Total outgoing byte rate",
"format": "Bps",
"gauge": {
"maxValue": 100,
"minValue": 0,
"show": false,
"thresholdLabels": false,
"thresholdMarkers": true
},
"gridPos": {
"h": 4,
"w": 6,
"x": 6,
"y": 19
},
"id": 99,
"interval": null,
"links": [],
"mappingType": 1,
"mappingTypes": [
{
"name": "value to text",
"value": 1
},
{
"name": "range to text",
"value": 2
}
],
"maxDataPoints": 100,
"nullPointMode": "connected",
"nullText": null,
"postfix": "",
"postfixFontSize": "50%",
"prefix": "",
"prefixFontSize": "50%",
"rangeMaps": [
{
"from": "null",
"text": "N/A",
"to": "null"
}
],
"repeatDirection": "h",
"sparkline": {
"fillColor": "rgba(31, 118, 189, 0.18)",
"full": false,
"lineColor": "rgb(31, 120, 193)",
"show": false
},
"tableColumn": "",
"targets": [
{
"expr": "sum(irate(kafka_server_brokertopicmetrics_bytesout_total{namespace=\"$kubernetes_namespace\",strimzi_io_cluster=\"$strimzi_cluster_name\",topic=~\"$kafka_topic\",topic!=\"\",kubernetes_pod_name=~\"$strimzi_cluster_name-$kafka_broker\"}[1m]))",
"format": "time_series",
"hide": false,
"intervalFactor": 1,
"legendFormat": "",
"refId": "A"
}
],
"thresholds": "0,2",
"title": "Total Outgoing Byte Rate",
"type": "singlestat",
"valueFontSize": "200%",
"valueMaps": [
{
"op": "=",
"text": "0",
"value": "null"
}
],
"valueName": "current"
},
{
"cacheTimeout": null,
"colorBackground": false,
"colorValue": true,
"colors": [
"#d44a3a",
"rgba(237, 129, 40, 0.89)",
"#299c46"
],
"datasource": "${DS_PROMETHEUS}",
"description": "Incoming messages rate",
"format": "wps",
"gauge": {
"maxValue": 100,
"minValue": 0,
"show": false,
"thresholdLabels": false,
"thresholdMarkers": true
},
"gridPos": {
"h": 4,
"w": 6,
"x": 12,
"y": 19
},
"id": 100,
"interval": null,
"links": [],
"mappingType": 1,
"mappingTypes": [
{
"name": "value to text",
"value": 1
},
{
"name": "range to text",
"value": 2
}
],
"maxDataPoints": 100,
"nullPointMode": "connected",
"nullText": null,
"postfix": "",
"postfixFontSize": "50%",
"prefix": "",
"prefixFontSize": "50%",
"rangeMaps": [
{
"from": "null",
"text": "N/A",
"to": "null"
}
],
"repeatDirection": "h",
"sparkline": {
"fillColor": "rgba(31, 118, 189, 0.18)",
"full": false,
"lineColor": "rgb(31, 120, 193)",
"show": false
},
"tableColumn": "",
"targets": [
{
"expr": "sum(irate(kafka_server_brokertopicmetrics_messagesin_total{namespace=\"$kubernetes_namespace\",strimzi_io_cluster=\"$strimzi_cluster_name\",topic=~\"$kafka_topic\",topic!=\"\",kubernetes_pod_name=~\"$strimzi_cluster_name-$kafka_broker\"}[1m]))",
"format": "time_series",
"hide": false,
"intervalFactor": 1,
"legendFormat": "",
"refId": "A"
}
],
"thresholds": "0,2",
"title": "Incoming Messages Rate",
"type": "singlestat",
"valueFontSize": "200%",
"valueMaps": [
{
"op": "=",
"text": "0",
"value": "null"
}
],
"valueName": "current"
},
{
"cacheTimeout": null,
"colorBackground": false,
"colorValue": true,
"colors": [
"#d44a3a",
"rgba(237, 129, 40, 0.89)",
"#299c46"
],
"datasource": "${DS_PROMETHEUS}",
"description": "Total produce request rate",
"format": "reqps",
"gauge": {
"maxValue": 100,
"minValue": 0,
"show": false,
"thresholdLabels": false,
"thresholdMarkers": true
},
"gridPos": {
"h": 4,
"w": 6,
"x": 18,
"y": 19
},
"id": 101,
"interval": null,
"links": [],
"mappingType": 1,
"mappingTypes": [
{
"name": "value to text",
"value": 1
},
{
"name": "range to text",
"value": 2
}
],
"maxDataPoints": 100,
"nullPointMode": "connected",
"nullText": null,
"postfix": "",
"postfixFontSize": "50%",
"prefix": "",
"prefixFontSize": "50%",
"rangeMaps": [
{
"from": "null",
"text": "N/A",
"to": "null"
}
],
"repeatDirection": "h",
"sparkline": {
"fillColor": "rgba(31, 118, 189, 0.18)",
"full": false,
"lineColor": "rgb(31, 120, 193)",
"show": false
},
"tableColumn": "",
"targets": [
{
"expr": "sum(irate(kafka_server_brokertopicmetrics_totalproducerequests_total{namespace=\"$kubernetes_namespace\",strimzi_io_cluster=\"$strimzi_cluster_name\",topic=~\"$kafka_topic\",topic!=\"\",kubernetes_pod_name=~\"$strimzi_cluster_name-$kafka_broker\"}[1m]))",
"format": "time_series",
"hide": false,
"intervalFactor": 1,
"legendFormat": "",
"refId": "A"
}
],
"thresholds": "0,2",
"title": "Total Produce Request Rate",
"type": "singlestat",
"valueFontSize": "200%",
"valueMaps": [
{
"op": "=",
"text": "0",
"value": "null"
}
],
"valueName": "current"
},
{
"aliasColors": {},
"bars": false,
"dashLength": 10,
"dashes": false,
"datasource": "${DS_PROMETHEUS}",
"description": "Byte rate",
"fill": 1,
"gridPos": {
"h": 8,
"w": 12,
"x": 0,
"y": 23
},
"id": 44,
"legend": {
"alignAsTable": false,
"avg": false,
"current": false,
"hideEmpty": false,
"hideZero": false,
"max": false,
"min": false,
"rightSide": false,
"show": true,
"total": false,
"values": false
},
"lines": true,
"linewidth": 1,
"links": [],
"nullPointMode": "null",
"paceLength": 10,
"percentage": false,
"pointradius": 5,
"points": false,
"renderer": "flot",
"seriesOverrides": [],
"spaceLength": 10,
"stack": false,
"steppedLine": false,
"targets": [
{
"expr": "sum(irate(kafka_server_brokertopicmetrics_bytesin_total{namespace=\"$kubernetes_namespace\",strimzi_io_cluster=\"$strimzi_cluster_name\",topic=~\"$kafka_topic\",topic!=\"\",kubernetes_pod_name=~\"$strimzi_cluster_name-$kafka_broker\"}[1m]))",
"format": "time_series",
"hide": false,
"instant": false,
"interval": "",
"intervalFactor": 1,
"legendFormat": "Total Incoming Byte Rate",
"refId": "A"
},
{
"expr": "sum(irate(kafka_server_brokertopicmetrics_bytesout_total{namespace=\"$kubernetes_namespace\",strimzi_io_cluster=\"$strimzi_cluster_name\",topic=~\"$kafka_topic\",topic!=\"\",kubernetes_pod_name=~\"$strimzi_cluster_name-$kafka_broker\"}[1m]))",
"format": "time_series",
"hide": false,
"intervalFactor": 1,
"legendFormat": "Total Outgoing Byte Rate",
"refId": "B"
}
],
"thresholds": [],
"timeFrom": null,
"timeRegions": [],
"timeShift": null,
"title": "Byte Rate",
"tooltip": {
"shared": true,
"sort": 0,
"value_type": "individual"
},
"type": "graph",
"xaxis": {
"buckets": null,
"mode": "time",
"name": null,
"show": true,
"values": []
},
"yaxes": [
{
"decimals": null,
"format": "bytes",
"label": "",
"logBase": 1,
"max": null,
"min": null,
"show": true
},
{
"format": "short",
"label": null,
"logBase": 1,
"max": null,
"min": null,
"show": true
}
],
"yaxis": {
"align": false,
"alignLevel": null
}
},
{
"aliasColors": {},
"bars": false,
"dashLength": 10,
"dashes": false,
"datasource": "${DS_PROMETHEUS}",
"fill": 1,
"gridPos": {
"h": 8,
"w": 12,
"x": 12,
"y": 23
},
"id": 58,
"legend": {
"alignAsTable": false,
"avg": false,
"current": false,
"max": false,
"min": false,
"show": true,
"total": false,
"values": false
},
"lines": true,
"linewidth": 1,
"links": [],
"nullPointMode": "null",
"paceLength": 10,
"percentage": false,
"pointradius": 5,
"points": false,
"renderer": "flot",
"seriesOverrides": [],
"spaceLength": 10,
"stack": false,
"steppedLine": false,
"targets": [
{
"expr": "sum(irate(kafka_server_brokertopicmetrics_messagesin_total{namespace=\"$kubernetes_namespace\",strimzi_io_cluster=\"$strimzi_cluster_name\",topic=~\"$kafka_topic\",topic!=\"\",kubernetes_pod_name=~\"$strimzi_cluster_name-$kafka_broker\"}[1m]))",
"format": "time_series",
"intervalFactor": 1,
"legendFormat": "Total Incoming Messages Rate",
"refId": "D"
}
],
"thresholds": [],
"timeFrom": null,
"timeRegions": [],
"timeShift": null,
"title": "Messages In Per Second",
"tooltip": {
"shared": true,
"sort": 0,
"value_type": "individual"
},
"type": "graph",
"xaxis": {
"buckets": null,
"mode": "time",
"name": null,
"show": true,
"values": []
},
"yaxes": [
{
"format": "short",
"label": null,
"logBase": 1,
"max": null,
"min": null,
"show": true
},
{
"format": "short",
"label": null,
"logBase": 1,
"max": null,
"min": null,
"show": true
}
],
"yaxis": {
"align": false,
"alignLevel": null
}
},
{
"aliasColors": {},
"bars": false,
"dashLength": 10,
"dashes": false,
"datasource": "${DS_PROMETHEUS}",
"description": "Produce request rate",
"fill": 1,
"gridPos": {
"h": 8,
"w": 12,
"x": 0,
"y": 31
},
"id": 50,
"legend": {
"avg": false,
"current": false,
"max": false,
"min": false,
"show": true,
"total": false,
"values": false
},
"lines": true,
"linewidth": 1,
"links": [],
"nullPointMode": "null",
"paceLength": 10,
"percentage": false,
"pointradius": 5,
"points": false,
"renderer": "flot",
"seriesOverrides": [],
"spaceLength": 10,
"stack": false,
"steppedLine": false,
"targets": [
{
"expr": "sum(irate(kafka_server_brokertopicmetrics_totalproducerequests_total{namespace=\"$kubernetes_namespace\",strimzi_io_cluster=\"$strimzi_cluster_name\",topic=~\"$kafka_topic\",topic!=\"\",kubernetes_pod_name=~\"$strimzi_cluster_name-$kafka_broker\"}[1m]))",
"format": "time_series",
"intervalFactor": 1,
"legendFormat": "Total Produce Request Rate",
"refId": "A"
},
{
"expr": "sum(irate(kafka_server_brokertopicmetrics_failedproducerequests_total{namespace=\"$kubernetes_namespace\",strimzi_io_cluster=\"$strimzi_cluster_name\",topic=~\"$kafka_topic\",topic!=\"\",kubernetes_pod_name=~\"$strimzi_cluster_name-$kafka_broker\"}[1m]))",
"format": "time_series",
"hide": false,
"intervalFactor": 1,
"legendFormat": "Failed Produce Request Rate",
"refId": "B"
}
],
"thresholds": [],
"timeFrom": null,
"timeRegions": [],
"timeShift": null,
"title": "Produce Request Rate",
"tooltip": {
"shared": true,
"sort": 0,
"value_type": "individual"
},
"type": "graph",
"xaxis": {
"buckets": null,
"mode": "time",
"name": null,
"show": true,
"values": []
},
"yaxes": [
{
"format": "short",
"label": null,
"logBase": 1,
"max": null,
"min": null,
"show": true
},
{
"format": "short",
"label": null,
"logBase": 1,
"max": null,
"min": null,
"show": true
}
],
"yaxis": {
"align": false,
"alignLevel": null
}
},
{
"aliasColors": {},
"bars": false,
"dashLength": 10,
"dashes": false,
"datasource": "${DS_PROMETHEUS}",
"description": "Fetch request rate",
"fill": 1,
"gridPos": {
"h": 8,
"w": 12,
"x": 12,
"y": 31
},
"id": 56,
"legend": {
"avg": false,
"current": false,
"max": false,
"min": false,
"show": true,
"total": false,
"values": false
},
"lines": true,
"linewidth": 1,
"links": [],
"nullPointMode": "null",
"paceLength": 10,
"percentage": false,
"pointradius": 5,
"points": false,
"renderer": "flot",
"seriesOverrides": [],
"spaceLength": 10,
"stack": false,
"steppedLine": false,
"targets": [
{
"expr": "sum(irate(kafka_server_brokertopicmetrics_totalfetchrequests_total{namespace=\"$kubernetes_namespace\",strimzi_io_cluster=\"$strimzi_cluster_name\",topic=~\"$kafka_topic\",topic!=\"\",kubernetes_pod_name=~\"$strimzi_cluster_name-$kafka_broker\"}[1m]))",
"format": "time_series",
"intervalFactor": 1,
"legendFormat": "Fetch Request Rate",
"refId": "A"
},
{
"expr": " sum(irate(kafka_server_brokertopicmetrics_failedfetchrequests_total{namespace=\"$kubernetes_namespace\",strimzi_io_cluster=\"$strimzi_cluster_name\",topic=~\"$kafka_topic\",topic!=\"\",kubernetes_pod_name=~\"$strimzi_cluster_name-$kafka_broker\"}[1m]))",
"format": "time_series",
"intervalFactor": 1,
"legendFormat": "Failed Fetch Request Rate",
"refId": "B"
}
],
"thresholds": [],
"timeFrom": null,
"timeRegions": [],
"timeShift": null,
"title": "Fetch Request Rate",
"tooltip": {
"shared": true,
"sort": 0,
"value_type": "individual"
},
"type": "graph",
"xaxis": {
"buckets": null,
"mode": "time",
"name": null,
"show": true,
"values": []
},
"yaxes": [
{
"format": "short",
"label": null,
"logBase": 1,
"max": null,
"min": null,
"show": true
},
{
"format": "short",
"label": null,
"logBase": 1,
"max": null,
"min": null,
"show": true
}
],
"yaxis": {
"align": false,
"alignLevel": null
}
},
{
"aliasColors": {},
"bars": false,
"dashLength": 10,
"dashes": false,
"datasource": "${DS_PROMETHEUS}",
"description": "Average percentage of time network processor is idle",
"fill": 1,
"gridPos": {
"h": 8,
"w": 12,
"x": 0,
"y": 39
},
"id": 60,
"legend": {
"avg": false,
"current": false,
"max": false,
"min": false,
"show": true,
"total": false,
"values": false
},
"lines": true,
"linewidth": 1,
"links": [],
"nullPointMode": "null",
"paceLength": 10,
"percentage": false,
"pointradius": 5,
"points": false,
"renderer": "flot",
"seriesOverrides": [],
"spaceLength": 10,
"stack": false,
"steppedLine": false,
"targets": [
{
"expr": "sum(kafka_network_socketserver_networkprocessoravgidle_percent{namespace=\"$kubernetes_namespace\",strimzi_io_cluster=\"$strimzi_cluster_name\",kubernetes_pod_name=~\"$strimzi_cluster_name-$kafka_broker\"}*100) by (kubernetes_pod_name)",
"format": "time_series",
"intervalFactor": 1,
"legendFormat": "{{kubernetes_pod_name}}",
"refId": "A"
}
],
"thresholds": [],
"timeFrom": null,
"timeRegions": [],
"timeShift": null,
"title": "Network Processor Avg Idle Percent",
"tooltip": {
"shared": true,
"sort": 0,
"value_type": "individual"
},
"type": "graph",
"xaxis": {
"buckets": null,
"mode": "time",
"name": null,
"show": true,
"values": []
},
"yaxes": [
{
"format": "percent",
"label": null,
"logBase": 1,
"max": null,
"min": null,
"show": true
},
{
"format": "short",
"label": null,
"logBase": 1,
"max": null,
"min": null,
"show": true
}
],
"yaxis": {
"align": false,
"alignLevel": null
}
},
{
"aliasColors": {},
"bars": false,
"dashLength": 10,
"dashes": false,
"datasource": "${DS_PROMETHEUS}",
"description": "Average percentage of time request handler threads are idle",
"fill": 1,
"gridPos": {
"h": 8,
"w": 12,
"x": 12,
"y": 39
},
"id": 62,
"legend": {
"avg": false,
"current": false,
"max": false,
"min": false,
"show": true,
"total": false,
"values": false
},
"lines": true,
"linewidth": 1,
"links": [],
"nullPointMode": "null",
"paceLength": 10,
"percentage": false,
"pointradius": 5,
"points": false,
"renderer": "flot",
"seriesOverrides": [],
"spaceLength": 10,
"stack": false,
"steppedLine": false,
"targets": [
{
"expr": "sum(kafka_server_kafkarequesthandlerpool_requesthandleravgidle_percent{namespace=\"$kubernetes_namespace\",strimzi_io_cluster=\"$strimzi_cluster_name\",kubernetes_pod_name=~\"$strimzi_cluster_name-$kafka_broker\"}*100) by (kubernetes_pod_name)",
"format": "time_series",
"hide": false,
"intervalFactor": 1,
"legendFormat": "{{kubernetes_pod_name}}",
"refId": "A"
}
],
"thresholds": [],
"timeFrom": null,
"timeRegions": [],
"timeShift": null,
"title": "Request Handler Avg Idle Percent",
"tooltip": {
"shared": true,
"sort": 0,
"value_type": "individual"
},
"type": "graph",
"xaxis": {
"buckets": null,
"mode": "time",
"name": null,
"show": true,
"values": []
},
"yaxes": [
{
"format": "percent",
"label": null,
"logBase": 1,
"max": null,
"min": null,
"show": true
},
{
"format": "short",
"label": null,
"logBase": 1,
"max": null,
"min": null,
"show": true
}
],
"yaxis": {
"align": false,
"alignLevel": null
}
},
{
"aliasColors": {},
"bars": false,
"dashLength": 10,
"dashes": false,
"datasource": "${DS_PROMETHEUS}",
"description": "Disk writes",
"fill": 1,
"gridPos": {
"h": 8,
"w": 8,
"x": 0,
"y": 47
},
"id": 104,
"legend": {
"avg": false,
"current": false,
"max": false,
"min": false,
"show": true,
"total": false,
"values": false
},
"lines": true,
"linewidth": 1,
"links": [],
"nullPointMode": "null",
"paceLength": 10,
"percentage": false,
"pointradius": 5,
"points": false,
"renderer": "flot",
"seriesOverrides": [],
"spaceLength": 10,
"stack": false,
"steppedLine": false,
"targets": [
{
"expr": "sum(irate(kafka_server_kafkaserver_linux_disk_write_bytes{namespace=\"$kubernetes_namespace\",strimzi_io_cluster=\"$strimzi_cluster_name\",kubernetes_pod_name=~\"$strimzi_cluster_name-$kafka_broker\"}[1m])) by (kubernetes_pod_name)",
"format": "time_series",
"hide": false,
"intervalFactor": 1,
"legendFormat": "{{kubernetes_pod_name}}",
"refId": "A"
}
],
"thresholds": [],
"timeFrom": null,
"timeRegions": [],
"timeShift": null,
"title": "Disk Writes",
"tooltip": {
"shared": true,
"sort": 0,
"value_type": "individual"
},
"type": "graph",
"xaxis": {
"buckets": null,
"mode": "time",
"name": null,
"show": true,
"values": []
},
"yaxes": [
{
"format": "bytes",
"label": null,
"logBase": 1,
"max": null,
"min": null,
"show": true
},
{
"format": "short",
"label": null,
"logBase": 1,
"max": null,
"min": null,
"show": true
}
],
"yaxis": {
"align": false,
"alignLevel": null
}
},
{
"aliasColors": {},
"bars": false,
"dashLength": 10,
"dashes": false,
"datasource": "${DS_PROMETHEUS}",
"description": "Disk reads",
"fill": 1,
"gridPos": {
"h": 8,
"w": 8,
"x": 8,
"y": 47
},
"id": 105,
"legend": {
"avg": false,
"current": false,
"max": false,
"min": false,
"show": true,
"total": false,
"values": false
},
"lines": true,
"linewidth": 1,
"links": [],
"nullPointMode": "null",
"paceLength": 10,
"percentage": false,
"pointradius": 5,
"points": false,
"renderer": "flot",
"seriesOverrides": [],
"spaceLength": 10,
"stack": false,
"steppedLine": false,
"targets": [
{
"expr": "sum(irate(kafka_server_kafkaserver_linux_disk_read_bytes{namespace=\"$kubernetes_namespace\",strimzi_io_cluster=\"$strimzi_cluster_name\",kubernetes_pod_name=~\"$strimzi_cluster_name-$kafka_broker\"}[1m])) by (kubernetes_pod_name)",
"format": "time_series",
"hide": false,
"intervalFactor": 1,
"legendFormat": "{{kubernetes_pod_name}}",
"refId": "A"
}
],
"thresholds": [],
"timeFrom": null,
"timeRegions": [],
"timeShift": null,
"title": "Disk Reads",
"tooltip": {
"shared": true,
"sort": 0,
"value_type": "individual"
},
"type": "graph",
"xaxis": {
"buckets": null,
"mode": "time",
"name": null,
"show": true,
"values": []
},
"yaxes": [
{
"format": "bytes",
"label": null,
"logBase": 1,
"max": null,
"min": null,
"show": true
},
{
"format": "short",
"label": null,
"logBase": 1,
"max": null,
"min": null,
"show": true
}
],
"yaxis": {
"align": false,
"alignLevel": null
}
},
{
"aliasColors": {},
"bars": false,
"dashLength": 10,
"dashes": false,
"datasource": "${DS_PROMETHEUS}",
"description": "Disk reads",
"fill": 1,
"gridPos": {
"h": 8,
"w": 8,
"x": 16,
"y": 47
},
"id": 106,
"legend": {
"avg": false,
"current": false,
"max": false,
"min": false,
"show": true,
"total": false,
"values": false
},
"lines": true,
"linewidth": 1,
"links": [],
"nullPointMode": "null",
"paceLength": 10,
"percentage": false,
"pointradius": 5,
"points": false,
"renderer": "flot",
"seriesOverrides": [],
"spaceLength": 10,
"stack": true,
"steppedLine": false,
"targets": [
{
"expr": "sum(kafka_server_socket_server_metrics_connection_count{namespace=\"$kubernetes_namespace\",strimzi_io_cluster=\"$strimzi_cluster_name\",kubernetes_pod_name=~\"$strimzi_cluster_name-$kafka_broker\"}) by (kubernetes_pod_name, listener)",
"format": "time_series",
"hide": false,
"intervalFactor": 1,
"legendFormat": "{{listener}}-{{kubernetes_pod_name}}",
"refId": "A"
}
],
"thresholds": [],
"timeFrom": null,
"timeRegions": [],
"timeShift": null,
"title": "Connection Count per Listener",
"tooltip": {
"shared": true,
"sort": 0,
"value_type": "individual"
},
"type": "graph",
"xaxis": {
"buckets": null,
"mode": "time",
"name": null,
"show": true,
"values": []
},
"yaxes": [
{
"format": "none",
"label": null,
"logBase": 1,
"max": null,
"min": null,
"show": true
},
{
"format": "short",
"label": null,
"logBase": 1,
"max": null,
"min": null,
"show": true
}
],
"yaxis": {
"align": false,
"alignLevel": null
}
},
{
"aliasColors": {},
"bars": false,
"dashLength": 10,
"dashes": false,
"datasource": "${DS_PROMETHEUS}",
"fill": 1,
"gridPos": {
"h": 13,
"w": 24,
"x": 0,
"y": 55
},
"id": 91,
"legend": {
"avg": false,
"current": false,
"max": false,
"min": false,
"show": true,
"total": false,
"values": false
},
"lines": true,
"linewidth": 1,
"links": [],
"nullPointMode": "null",
"paceLength": 10,
"percentage": false,
"pointradius": 5,
"points": false,
"renderer": "flot",
"seriesOverrides": [],
"spaceLength": 10,
"stack": false,
"steppedLine": false,
"targets": [
{
"expr": "kafka_log_log_size{namespace=\"$kubernetes_namespace\",strimzi_io_cluster=\"$strimzi_cluster_name\",kubernetes_pod_name=~\"$strimzi_cluster_name-$kafka_broker\",topic=~\"$kafka_topic\",partition=~\"$kafka_partition\"}",
"format": "time_series",
"instant": false,
"intervalFactor": 1,
"legendFormat": "{{topic}}:{{partition}}",
"refId": "A"
}
],
"thresholds": [],
"timeFrom": null,
"timeRegions": [],
"timeShift": null,
"title": "Log Size",
"tooltip": {
"shared": true,
"sort": 0,
"value_type": "individual"
},
"type": "graph",
"xaxis": {
"buckets": null,
"mode": "time",
"name": null,
"show": true,
"values": []
},
"yaxes": [
{
"format": "bytes",
"label": null,
"logBase": 1,
"max": null,
"min": null,
"show": true
},
{
"format": "short",
"label": null,
"logBase": 1,
"max": null,
"min": null,
"show": true
}
],
"yaxis": {
"align": false,
"alignLevel": null
}
}
],
"refresh": "5s",
"schemaVersion": 21,
"style": "dark",
"tags": [
"Strimzi",
"Kafka"
],
"templating": {
"list": [
{
"allValue": null,
"current": {},
"datasource": "${DS_PROMETHEUS}",
"definition": "",
"hide": 0,
"includeAll": false,
"label": "Namespace",
"multi": false,
"name": "kubernetes_namespace",
"options": [],
"query": "query_result(kafka_server_replicamanager_leadercount)",
"refresh": 1,
"regex": "/.*namespace=\"([^\"]*).*/",
"skipUrlSync": false,
"sort": 0,
"tagValuesQuery": "",
"tags": [],
"tagsQuery": "",
"type": "query",
"useTags": false
},
{
"allValue": null,
"current": {},
"datasource": "${DS_PROMETHEUS}",
"definition": "",
"hide": 0,
"includeAll": false,
"label": "Cluster Name",
"multi": false,
"name": "strimzi_cluster_name",
"options": [],
"query": "query_result(kafka_server_replicamanager_leadercount{namespace=\"$kubernetes_namespace\"})",
"refresh": 1,
"regex": "/.*strimzi_io_cluster=\"([^\"]*).*/",
"skipUrlSync": false,
"sort": 0,
"tagValuesQuery": "",
"tags": [],
"tagsQuery": "",
"type": "query",
"useTags": false
},
{
"allValue": ".*",
"current": {},
"datasource": "${DS_PROMETHEUS}",
"definition": "",
"hide": 0,
"includeAll": true,
"label": "Broker",
"multi": false,
"name": "kafka_broker",
"options": [],
"query": "query_result(kafka_server_replicamanager_leadercount{namespace=\"$kubernetes_namespace\",strimzi_io_cluster=\"$strimzi_cluster_name\"})",
"refresh": 1,
"regex": "/.*pod_name=\"$strimzi_cluster_name-([^\"]*).*/",
"skipUrlSync": false,
"sort": 0,
"tagValuesQuery": "",
"tags": [],
"tagsQuery": "",
"type": "query",
"useTags": false
},
{
"allValue": ".+",
"current": {},
"datasource": "${DS_PROMETHEUS}",
"definition": "",
"hide": 0,
"includeAll": true,
"label": "Topic",
"multi": false,
"name": "kafka_topic",
"options": [],
"query": "query_result(kafka_cluster_partition_replicascount{namespace=\"$kubernetes_namespace\",strimzi_io_cluster=\"$strimzi_cluster_name\",kubernetes_pod_name=~\"$strimzi_cluster_name-$kafka_broker\"})",
"refresh": 1,
"regex": "/.*topic=\"([^\"]*).*/",
"skipUrlSync": false,
"sort": 0,
"tagValuesQuery": "",
"tags": [],
"tagsQuery": "",
"type": "query",
"useTags": false
},
{
"allValue": ".*",
"current": {},
"datasource": "${DS_PROMETHEUS}",
"definition": "",
"hide": 0,
"includeAll": true,
"label": "Partition",
"multi": true,
"name": "kafka_partition",
"options": [],
"query": "query_result(kafka_log_log_size{namespace=\"$kubernetes_namespace\",strimzi_io_cluster=\"$strimzi_cluster_name\",kubernetes_pod_name=~\"$strimzi_cluster_name-$kafka_broker\",topic=~\"$kafka_topic\"})",
"refresh": 1,
"regex": "/.*partition=\"([^\"]*).*/",
"skipUrlSync": false,
"sort": 3,
"tagValuesQuery": "",
"tags": [],
"tagsQuery": "",
"type": "query",
"useTags": false
}
]
},
"time": {
"from": "now-1h",
"to": "now"
},
"timepicker": {
"refresh_intervals": [
"5s",
"10s",
"30s",
"1m",
"5m",
"15m",
"30m",
"1h",
"2h",
"1d"
],
"time_options": [
"5m",
"15m",
"1h",
"6h",
"12h",
"24h",
"2d",
"7d",
"30d"
]
},
"timezone": "",
"title": "Strimzi Kafka",
"uid": "86cc98e66c294b299b37102f0cc74ead",
"version": 2
}
I was able to automatically install Strimzi Grafana dashboards via configmaps with kubectl create -f dashbords-dir/<all-dashboards.yaml, by setting datasources to either Prometheus, or null , depending on where it was required. The configmap has the necessary grafana label so that they get picked up.
I've done the same thing with other projects, and edited the values.yaml with something like dashboards.enabled, then at the top of all my new dashboard.yaml's in templates/dashboards/ of that chart, I just have the classic {{ -if .Values.dashboards.enabled }}, and then the json below. Again, these dashboard yamls (with the json inside of them using |, have datasource set to Prometheus, or null
Grafana can be indeed very confusing when it comes to saving and importing dashboards, some ways are intended for manual import, others for provisioning which is not very clear in the docs or the UI.
However, I'm not sure adding the datasource as a template variable is the correct solution for this particular problem, it's more of a workaround. To provision dashboards you need the raw dashboard JSON (from the dashboard settings) saved to a file (that way there's no DS_PROMETHEUS) and the id is removed.
Can you please confirm that following this path works for your case? You can find it documented in the administration docs under provisioning . If it works, I think we we can then update the dashboards in the examples to be the raw JSON instead of the ones exported, which should work for both cases of provisioning and manual importing.
Hi Niclas, Referring to my comment above, can you please try using the "raw dashboard JSON" in the ConfigMap, instead of the the json here in the repo? Meaning:
-
Using a grafana dashboard, manually import the dashboard json file that you want from the the example dashboards folders .
-
Visit the dashboard, then save it as a raw dashboad JSON by following this guide (i.e
Copy JSON to ClipboardorSave JSON to file)
-
Use this JSON in your ConfigMap
So it'd be great if you can report if that works without errors, so that maybe we can change the json files in the repo to the raw ones.
Hey Ahmed, so I gave this a try with the following steps:
- Manually imported strimzi-kafka.json and selected our datasource.
- Visited the manually imported dashboard and exported the JSON output.
- Pasted the exported JSON into our ConfigMap
Et voilà, it's (partially) working:
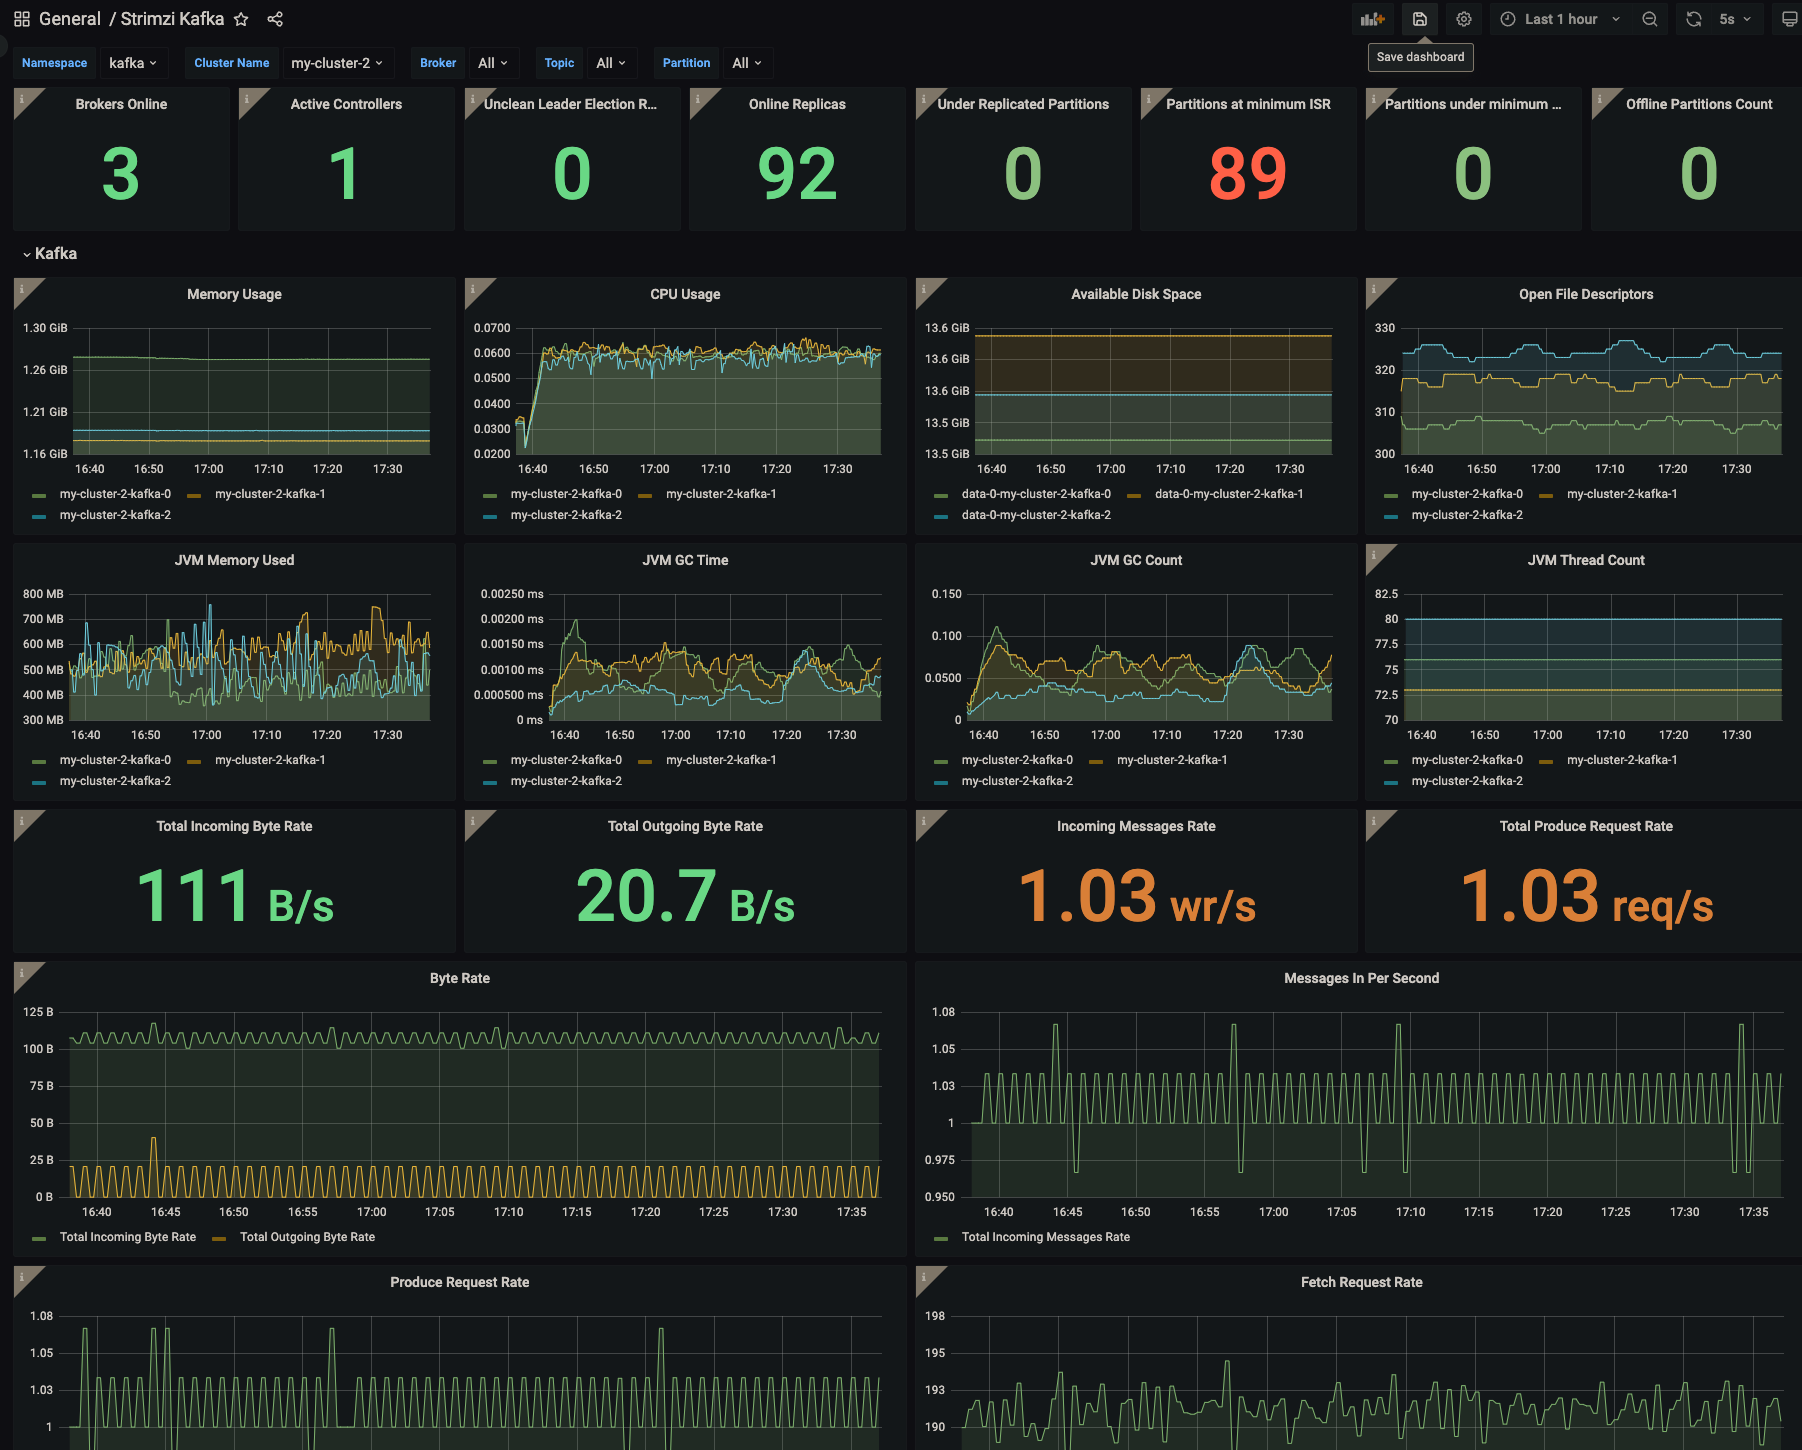
The mirror-maker-2 dashboard does not work because we aren't getting the kafka_connect_worker_connector_count metrics from Prometheus. We already deployed the prometheus-additional.yaml to get the metrics needed for all the other dashboards, however that doesn't seem to be enough?