spring-cloud-sleuth
 spring-cloud-sleuth copied to clipboard
Spans opened by reactive WebClient .retry() are not nested correctly
Preface I have two Spring WebFlux apps with configured Sleuth and Jaeger server. One app has an /error functional endpoint that returns 500 error. Other has a /test functional endpoint that sends a request to the /error. I'm using a Spring reactive WebClient to send a http request. With a .retry(...) added to the web client mono chain.
Description App ONE sends a request to app TWO /error endpoint, gets a 500 error, and makes 3 more retry requests.
The problem is that TWO's spans opened by retry are not nested under corresponding ONE's web-client individual request spans. By the timeline you can see which TWO belongs to which ONE span.

Resources Code: https://github.com/archie-swif/sleuth-webclient-retry Run two instances of the application, one with 'one' spring profile, another with 'two'.
ONE's log: https://gist.github.com/archie-swif/2dfbf28c0837830cd75ad68c069079d8 TWO's log: https://gist.github.com/archie-swif/c0103c6e695c01d8c6786a6940335ea5
Trace JSON from Jaeger: https://gist.github.com/archie-swif/d2453c556272371fd5961a4bc243cccb
using jaeger is unnecessary for an example like this and also makes it harder to troubleshoot. sleuth emits spans in zipkin v2 format then jaeger converts to something else. can you please post the actual json sent? easiest way to do this is run your same code against zipkin. the problem should not be backend specific this is just to remove unnecessary distractions
On Fri, 2 Nov 2018, 06:12 Artem Ryabokon, [email protected] wrote:
Preface I have two Spring WebFlux apps with configured Sleuth and Jaeger server. One app has an /error functional endpoint that returns 500 error. Other has a /test functional endpoint that sends a request to the /error. I'm using a Spring reactive WebClient to send a http request. With a .retry(...) added to the web client mono chain.
Description App ONE sends a request to app TWO /error endpoint, gets a 500 error, and makes 3 more retry requests.
The problem is that TWO's spans opened by retry are not nested under ONE's web-client individual request spans. They are nested under TWO's first error span. First TWO's span and TWO's spans without retry are nested correctly.
[image: jeager] https://user-images.githubusercontent.com/2158707/47879564-28b18180-ddde-11e8-85b9-ec245b270974.png
Resources Code: https://github.com/archie-swif/sleuth-webclient-retry Run two instances of the application, one with 'one' spring profile, another with 'two'.
ONE's log: https://gist.github.com/archie-swif/2dfbf28c0837830cd75ad68c069079d8 TWO's log: https://gist.github.com/archie-swif/c0103c6e695c01d8c6786a6940335ea5
Trace JSON from Jaeger: https://gist.github.com/archie-swif/d2453c556272371fd5961a4bc243cccb
— You are receiving this because you are subscribed to this thread. Reply to this email directly, view it on GitHub https://github.com/spring-cloud/spring-cloud-sleuth/issues/1121, or mute the thread https://github.com/notifications/unsubscribe-auth/AAD619RgEEvMjN7F_nMn3-pMSkTGU1eCks5uq2PJgaJpZM4YJSjm .
@adriancole Sure, no problem.
Trace JSON: https://gist.github.com/archie-swif/81ea16a55ae9dccf3f2505257f2beac4 Logs: https://gist.github.com/archie-swif/2e98e07fb667ff391ed36e5b2402a211
That's how it looks in Zipkin. There is only a single TWO span for some reason, for the exact scenario.
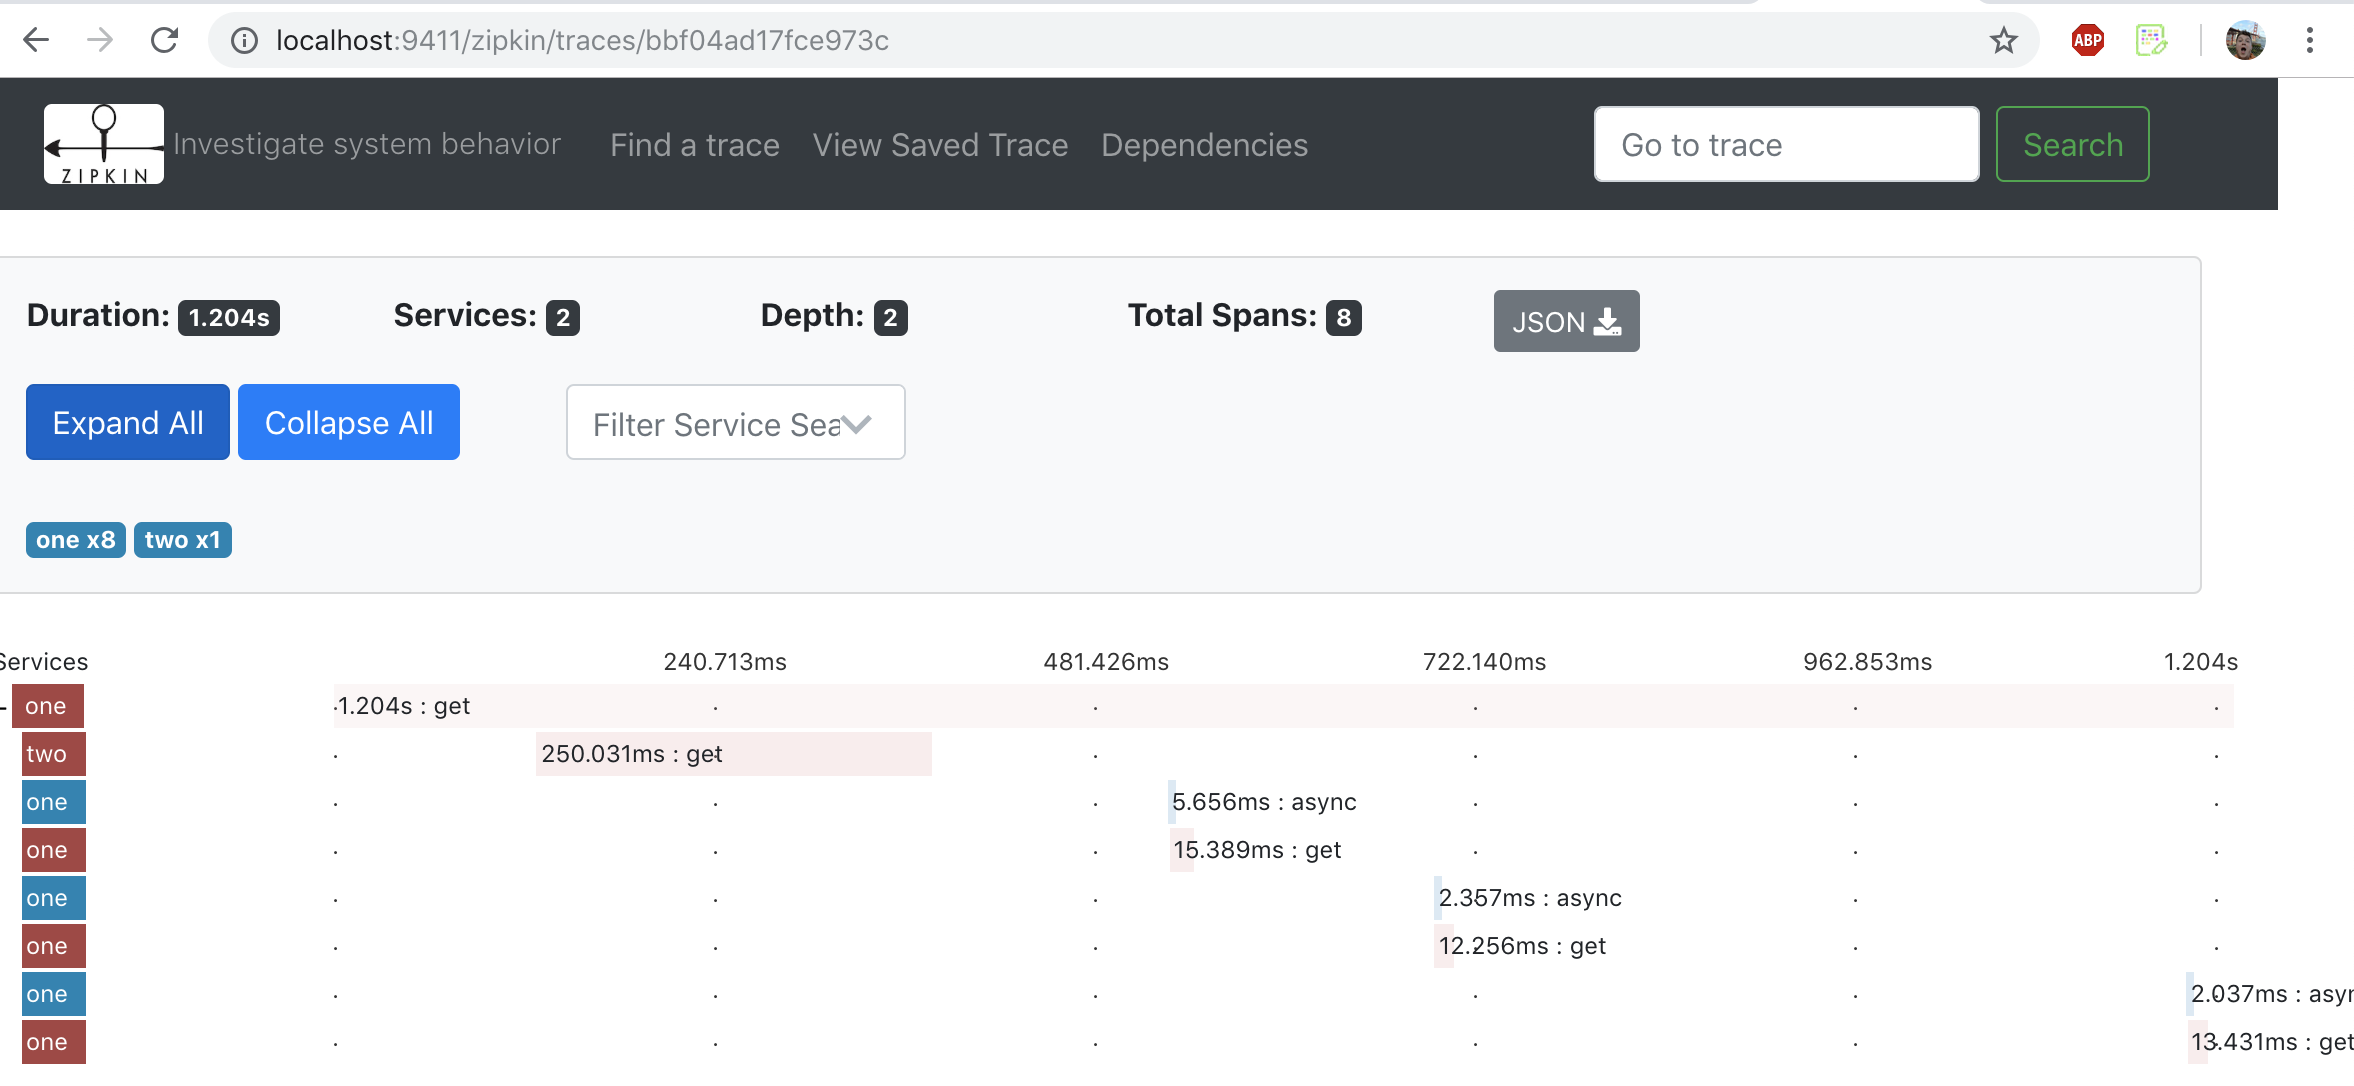
In the JSON I see that there are 4 get records for app TWO, with the same Span Id ddc5003cea7888a7
  {
    "traceId": "bbf04ad17fce973c",
    "parentId": "bbf04ad17fce973c",
    "id": "ddc5003cea7888a7",
    "kind": "SERVER",
    "name": "get",
    "timestamp": 1541124521469143,
    "duration": 3361,
    "localEndpoint": {
      "serviceName": "two",
      "ipv4": "172.31.99.80"
    },
    "tags": {
      "error": "500",
      "http.method": "GET",
      "http.path": "/error",
      "http.status_code": "500"
    },
    "shared": true
  },
For the app ONE, there is one get record with the same Span Id ddc5003cea7888a7 And three more get records with unique Span Ids.
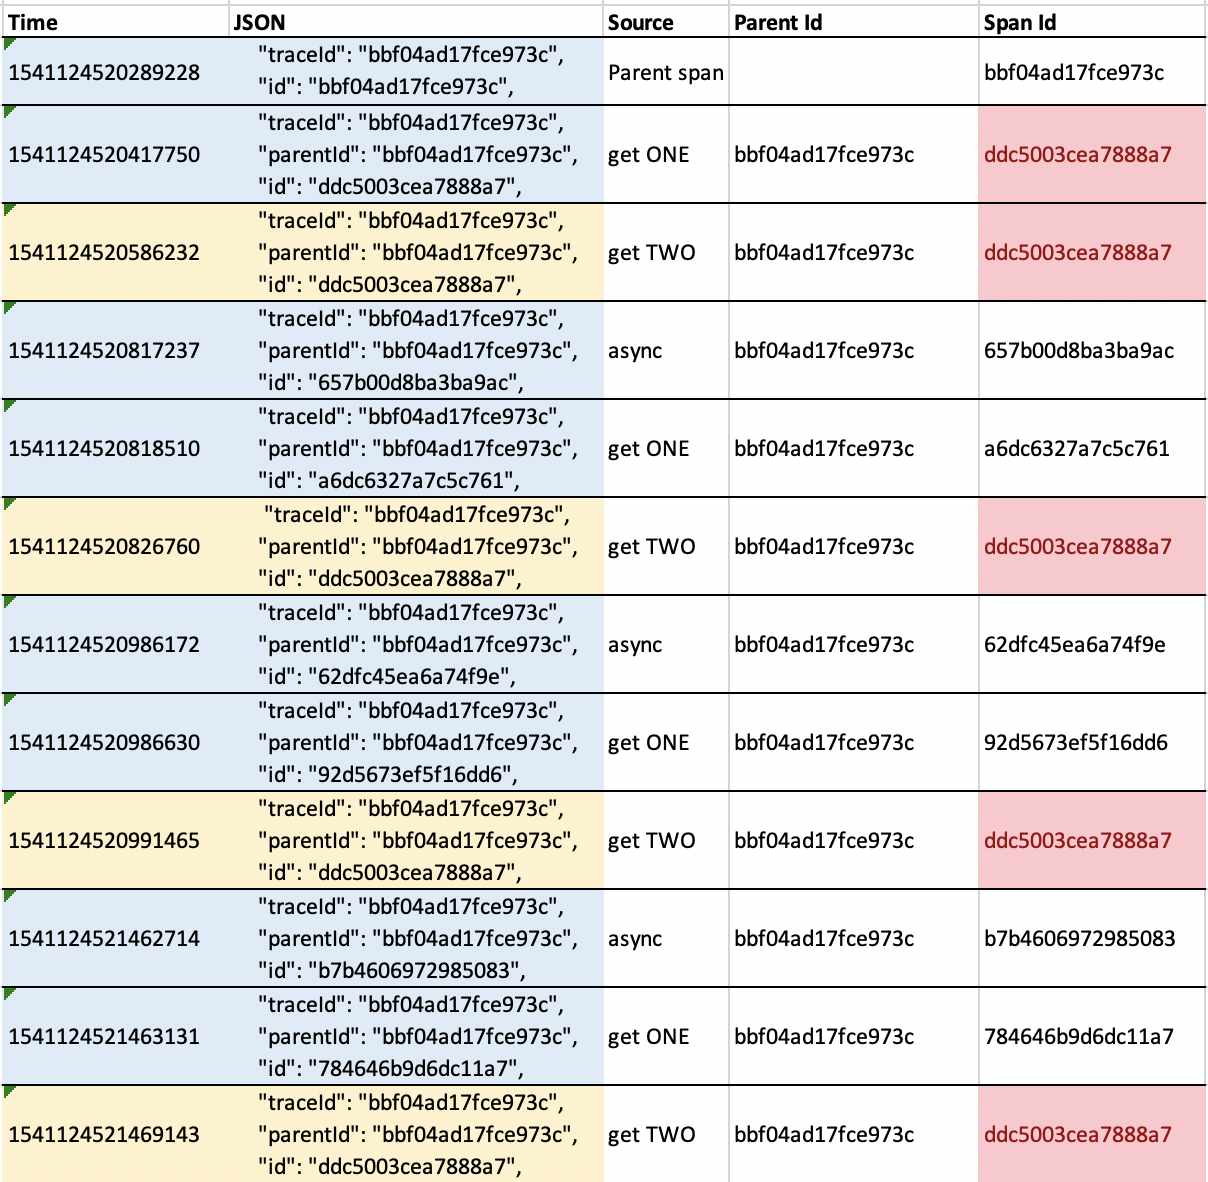
I would expect get TWO records to be nested under get ONE's Span, this way:
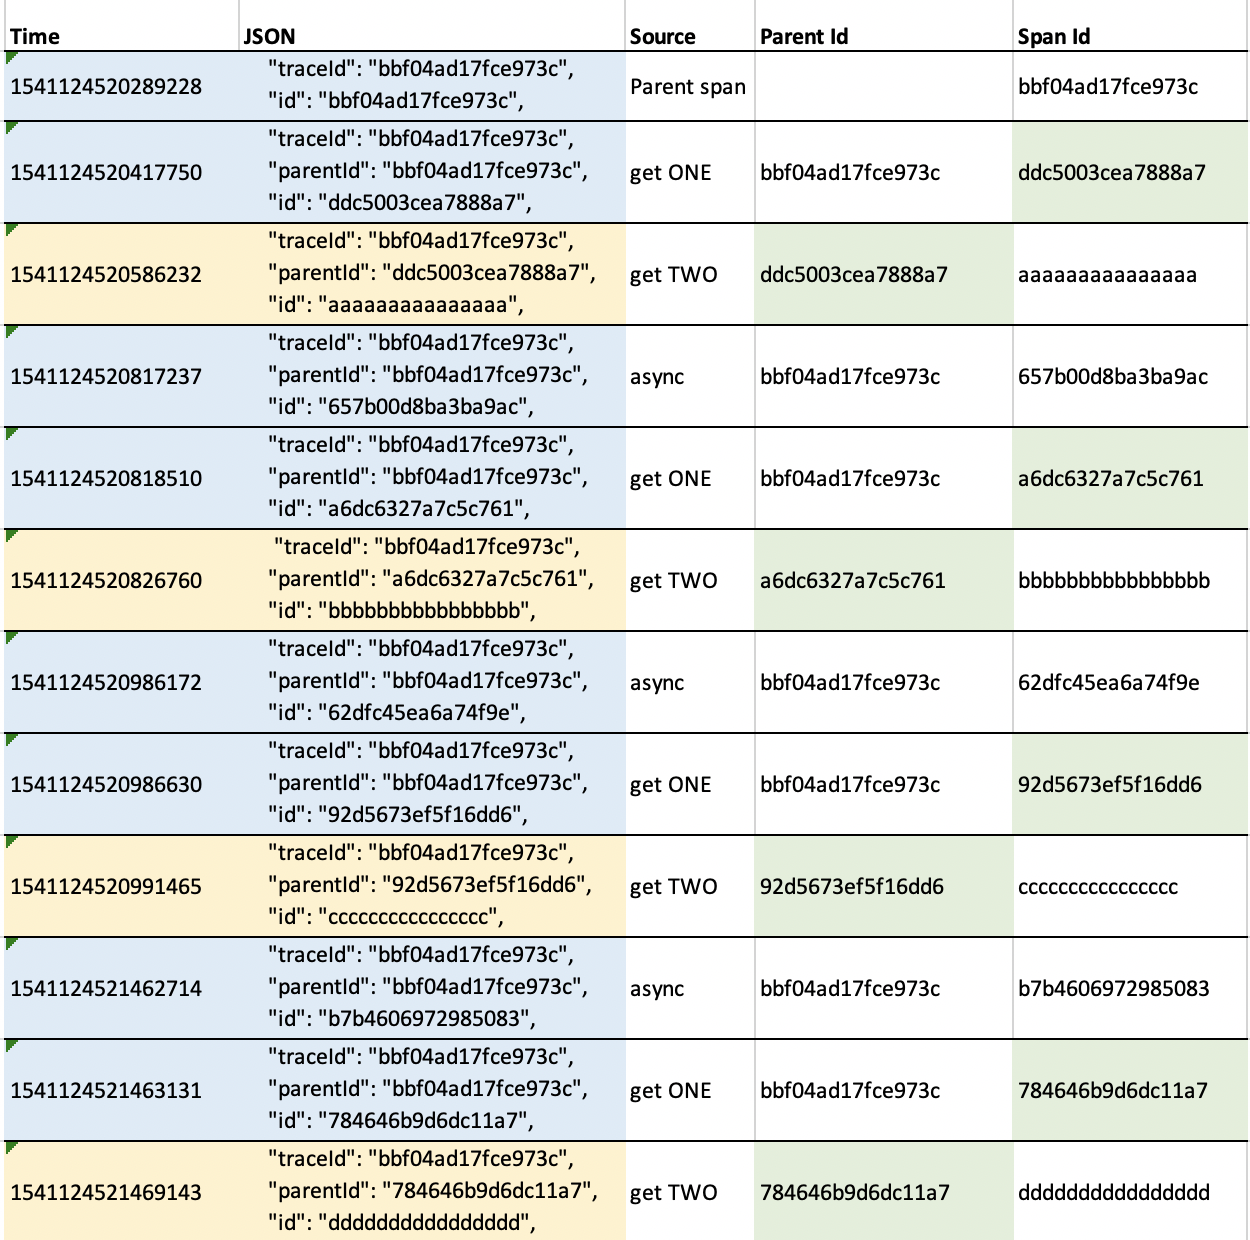
Expected JSON: https://gist.github.com/archie-swif/5170bfd5118cf0b66e128607aea0727b
Imported in Zipkin:

Can you try with latest 2.1.0 snapshots?
It looks better with 2.1.0.BUILD-SNAPSHOT spring-boot-starter-parent. But still has some problems.

Trace JSON: https://gist.github.com/archie-swif/513bcf9cc97a87938f2491bca0d950c8 Logs: https://gist.github.com/archie-swif/10282e2039c232b9b2889028e06ffd5f

So, 2.1.0 snapshots did not help with for this issue
However I see that Span IDs in TWO's logs are now unique Let me take a closer look
With 2.1.0 Snapshot, ID assignment has changed. Now each WebClient GET call on app ONE opens a span with unique id. And app TWO code is executed in the span with those id.
Still, I would expect a new span opened when app TWO code is executed. And this span be nested under app ONE's WebClient GET span. Please correct me if I'm wrong with this. Thank you!
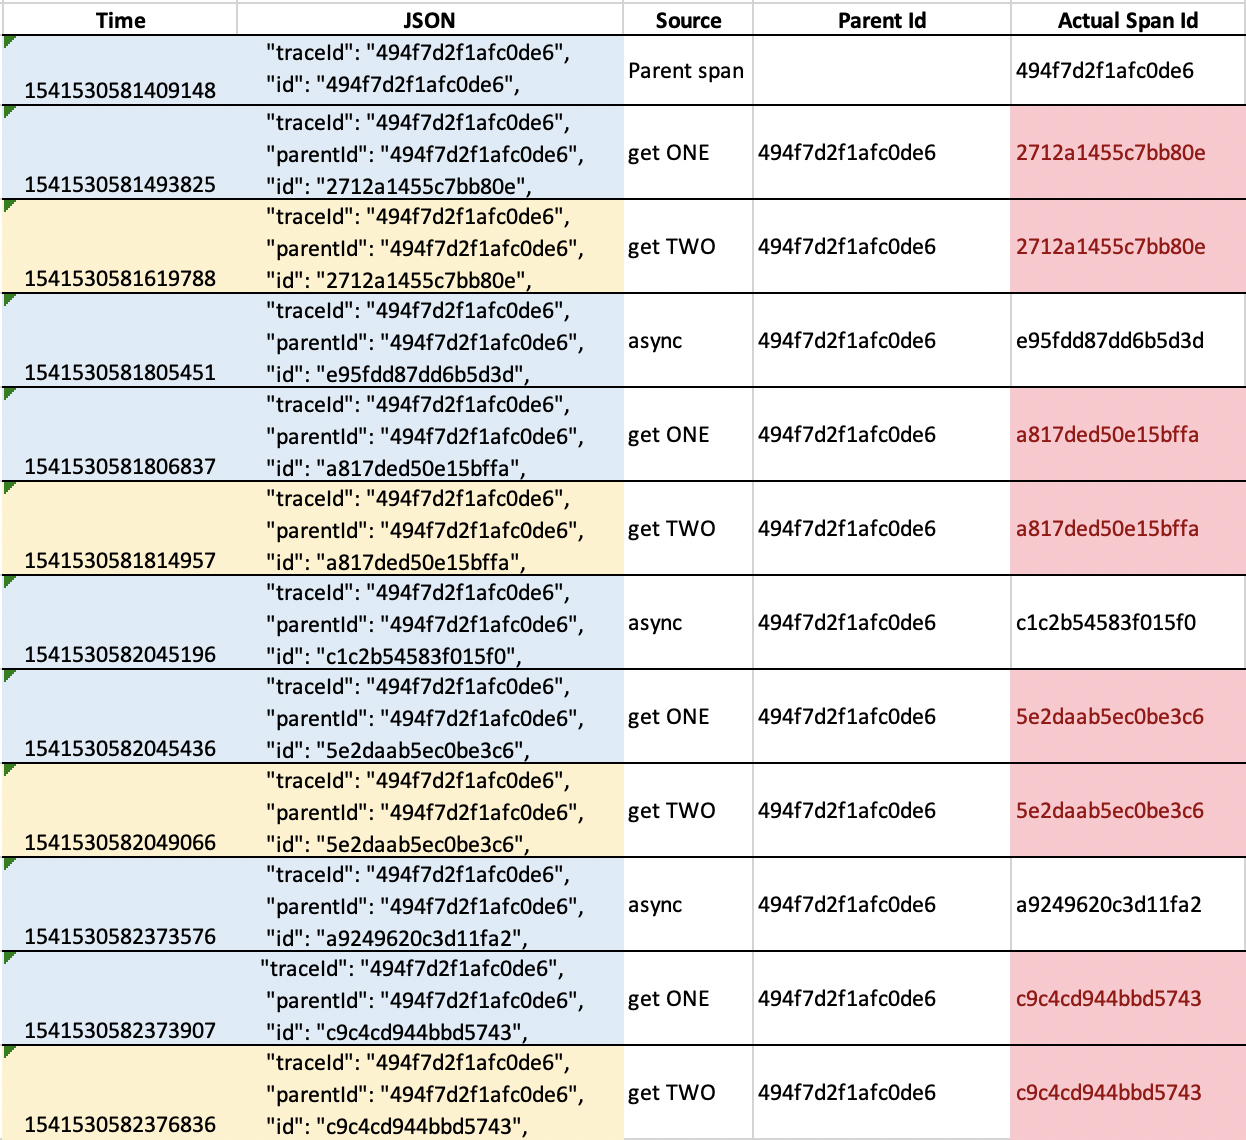
Maybe I don't understand sth but when I look at the graph right now, that seems to be ok. Each call to two has a unique ID

Can you sketch how it should look like in your opinion?
There was an expected picture bit earlier, with two “get” bars under each “async”. https://github.com/spring-cloud/spring-cloud-sleuth/issues/1121#issuecomment-435275230
Now Id is unique for each call, but is duplicated for “get” in scope of each individual request. This way one of the “get” block is lost on the chart.
Hey @archie-swif can you check if the latest versions work fine for that matter?
Hi @marcingrzejszczak , thanks for checking up!
I have tried it with Spring Boot 2.3.2.RELEASE, 2.4.0-SNAPSHOT, and latest zipkin image 2.21.5.
Here is how it looks by default:
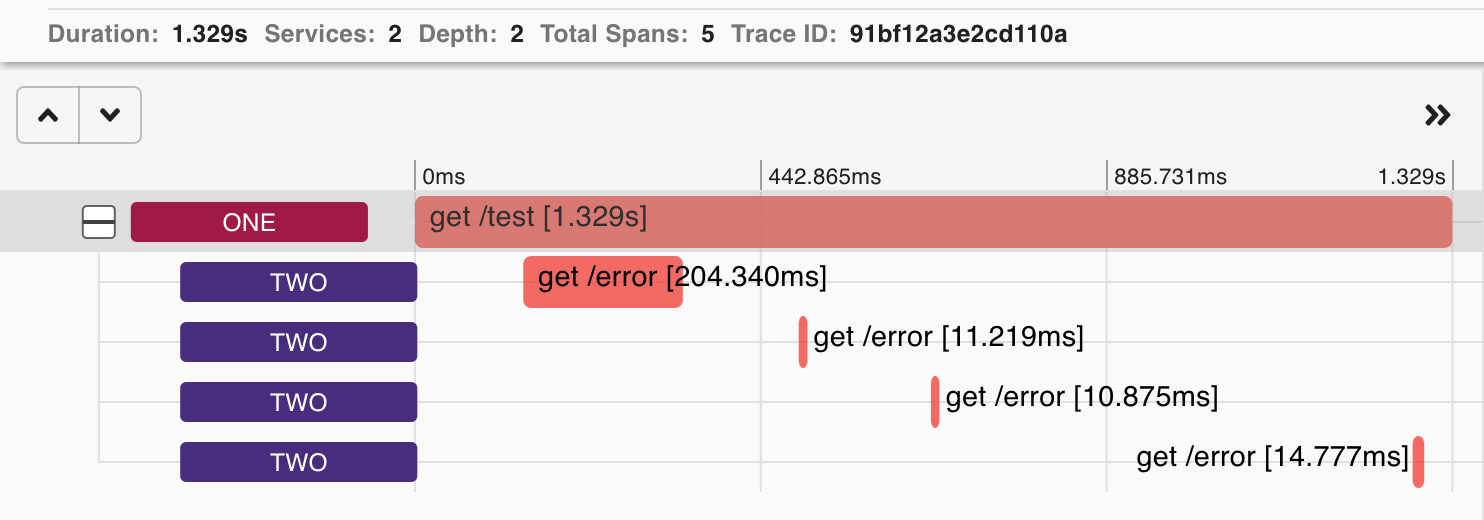
I see that more spans of the service ONE are present in json, but they are not visible in zipkin UI. It looks like the issue is in non unique "id" values in span objects. Zipkins takes the one span with an unique id and ignores others with the same id.
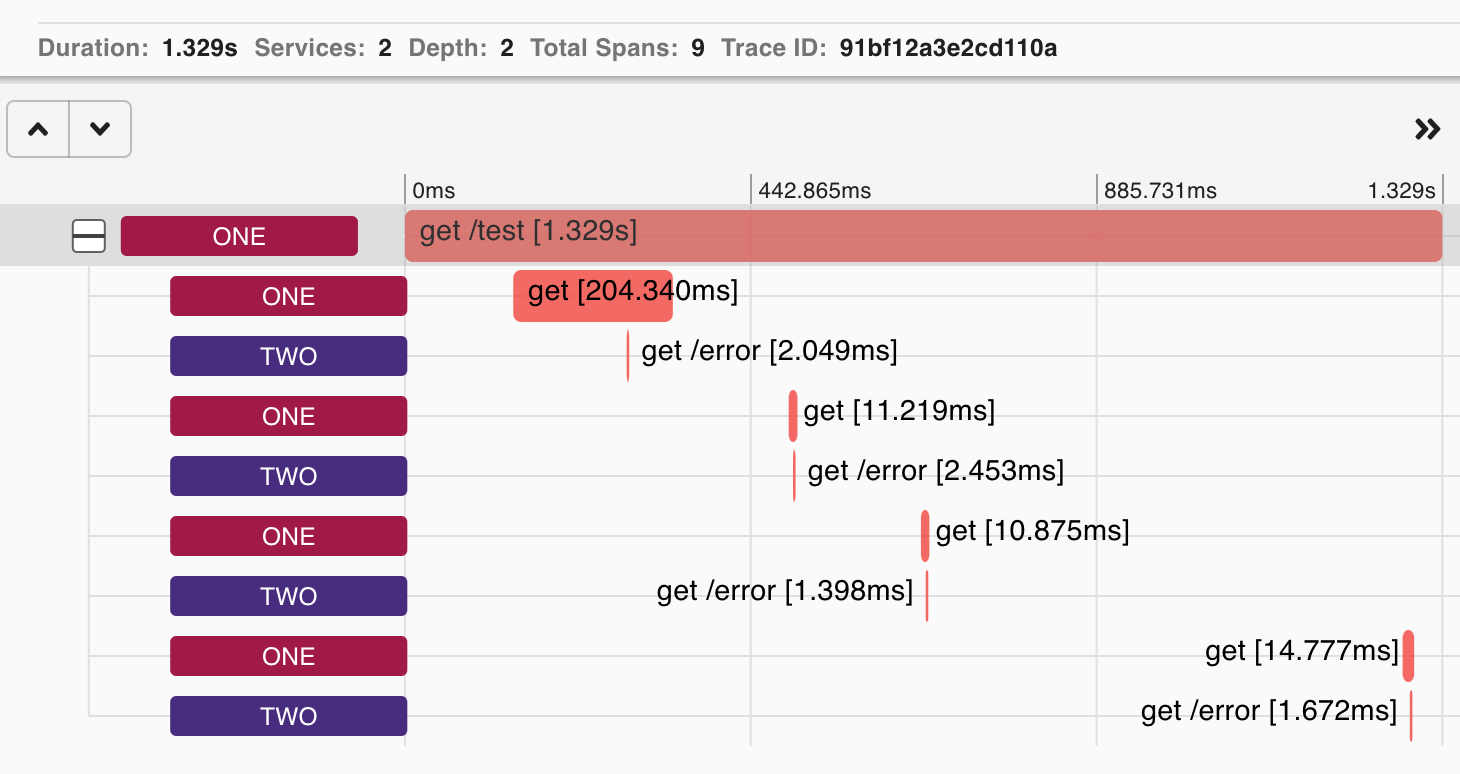
If exported trace json is updated so that all ids are unique: https://github.com/archie-swif/sleuth-webclient-retry/commit/853173bae76492ae74fbbd8aaba4d4cc2741617a
Then it looks this way, no spans are lost:
Thank you!
I've bumped boot to 2.4.0 and Cloud to 2020.0.0-SNAPSHOT and I got the following trace

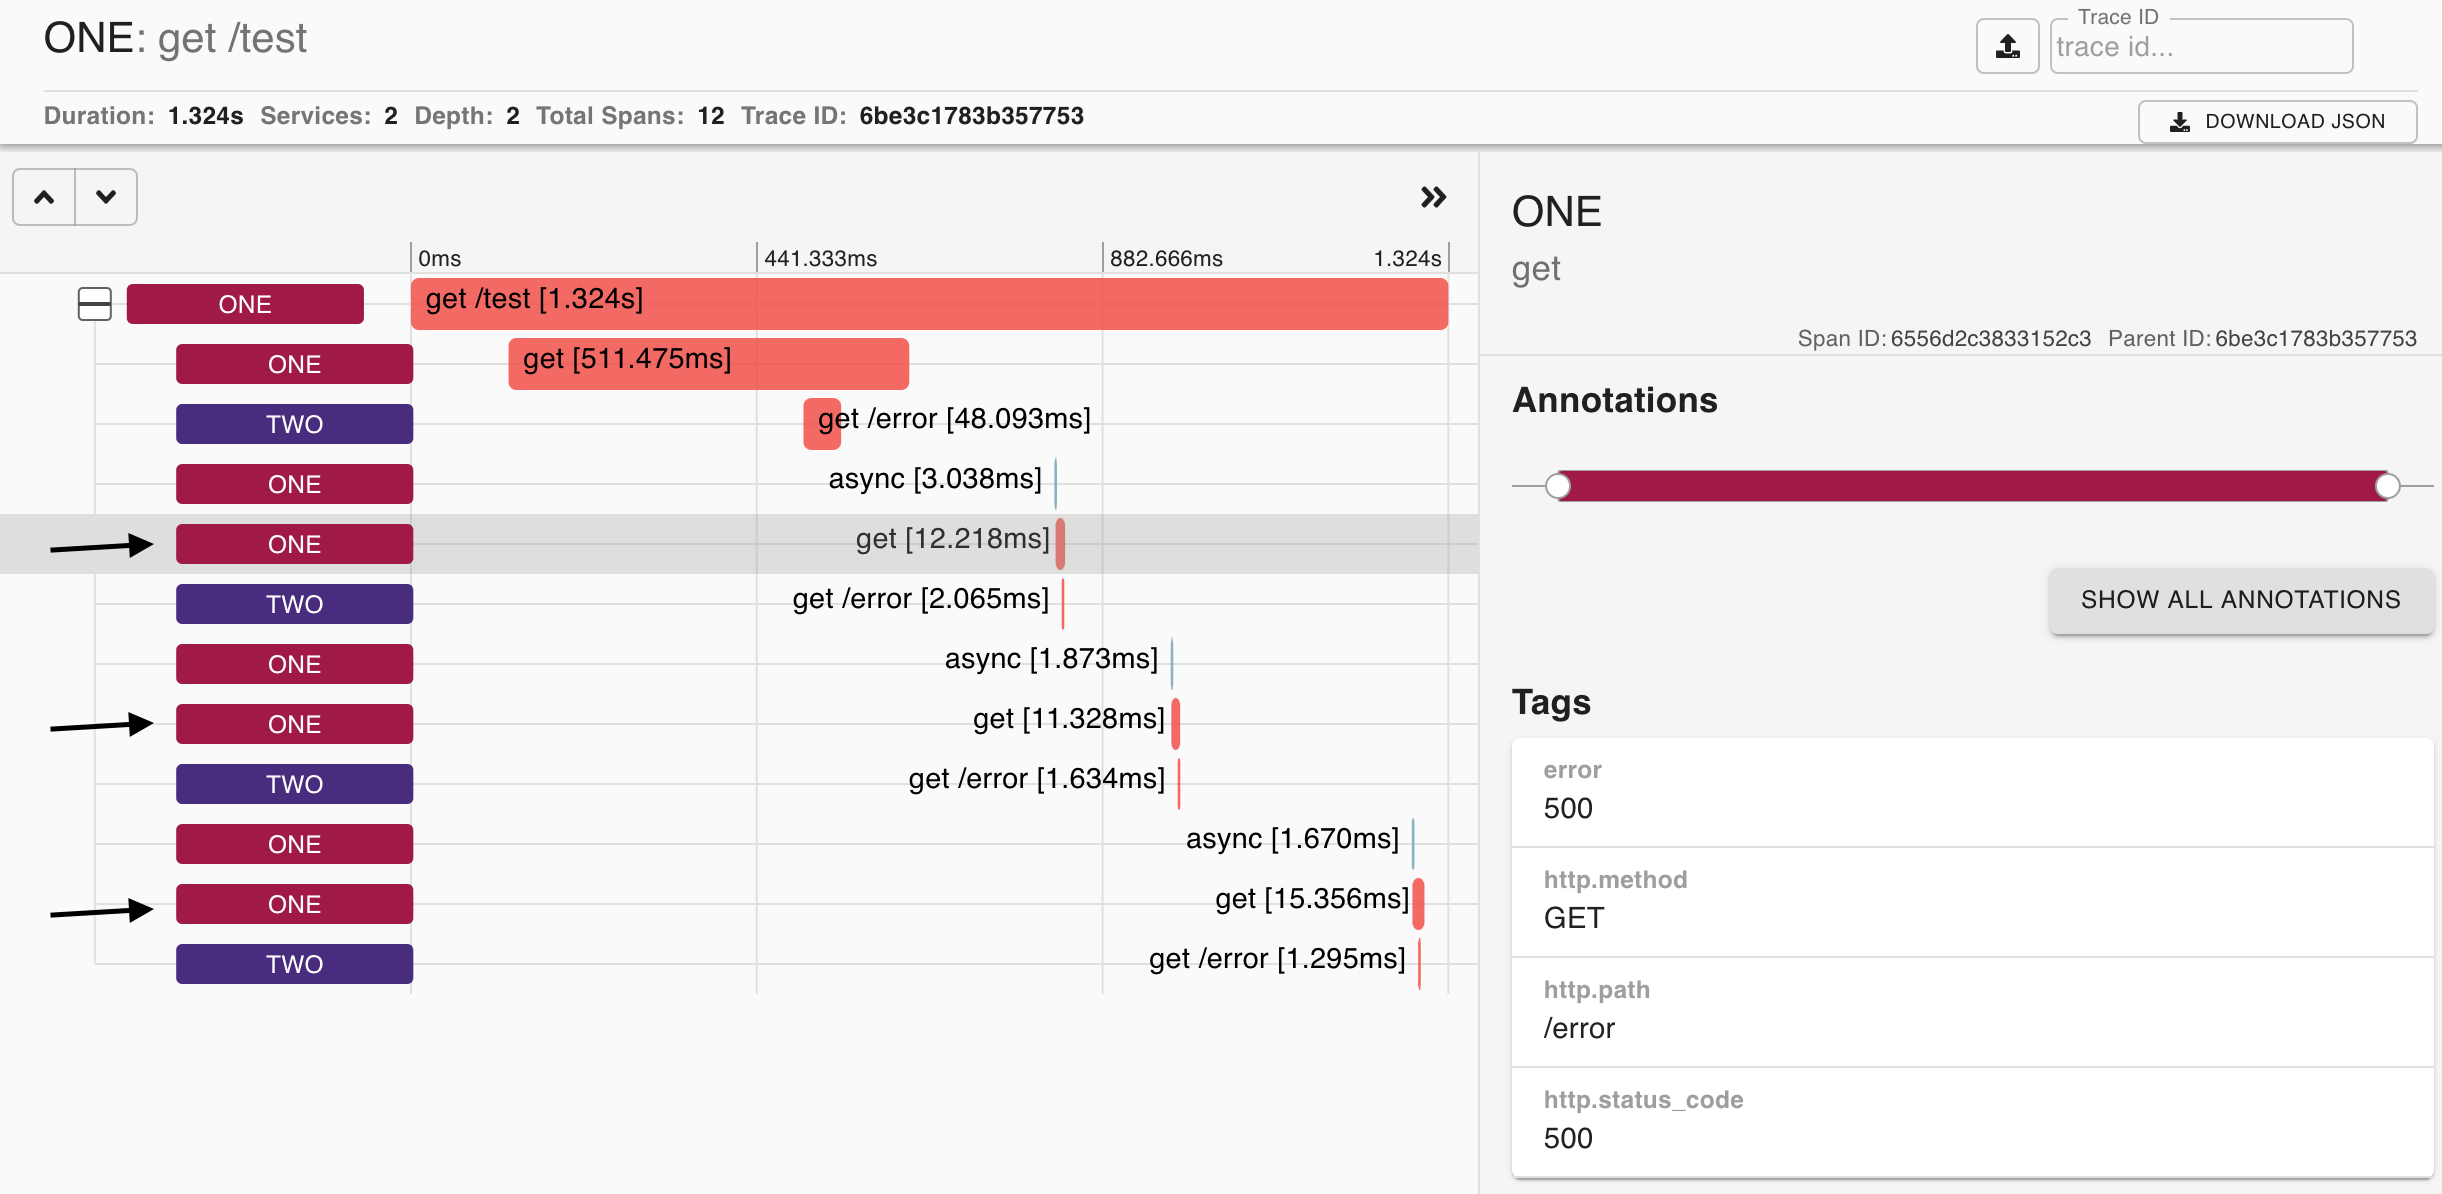
I guess it looks better? Still I don't see the controllers from one but async which is interesting... I guess this async is a retry attempt
In 2.4.0, additional "async" span is being tracked, but ONE's "get" span is still ignored, even if it's present in json. After id fix it looks this way:
Please upgrade to Micrometer Tracing. Spring Cloud Sleuth is feature complete and out of OSS support.