squidpy
 squidpy copied to clipboard
sc.pl.spatial color
Hi, when I plot leiden clusters with sc.pl.spatial(adata[adata.obs['sample']=="C8"],library_id="C8",color=['n_genes_by_counts','leiden']), the color of each leiden cluster became disordered. There are 3 samples (C6, C7, C8) in my anndata object and was clustered into 13 clusters. If each sample has all the 13 clusters, then the color will be right, but when the cluster number is different (such as C7 has 12 clusters, while C8 and C6 has 13 clusters, the color will be disordered. It seems that squidpy assign leiden colors by the sequence of the color, not the cluster names. I think It is the case in scanpy and squidpy.
Hi @wangjiawen2013 , could you please a minimal reproducible example for me to look at?
please see scanpy tutorial:
https://scanpy-tutorials.readthedocs.io/en/latest/spatial/integration-scanorama.html
I think the [11] and [12] make the right cluster color.
If I delete[11] and change the code[12] to the following, I think the color will be disordered:
 for i, library in enumerate( ["V1_Mouse_Brain_Sagittal_Anterior", "V1_Mouse_Brain_Sagittal_Posterior"]):
    ad = adata_spatial[adata_spatial.obs.library_id == library, :].copy()
    sc.pl.spatial(
        ad,
        img_key="hires",
        library_id=library,
        color="clusters",
        size=1.5)
Are there an simple way to plot without saving the cluster colors in a dictionary first, then I can plot easily with the code like I metioned above
sc.pl.spatial(adata[adata.obs['library_id']=="V1_Mouse_Brain_Sagittal_Anterior"],library_id="V1_Mouse_Brain_Sagittal_Anterior",color="clusters")
?
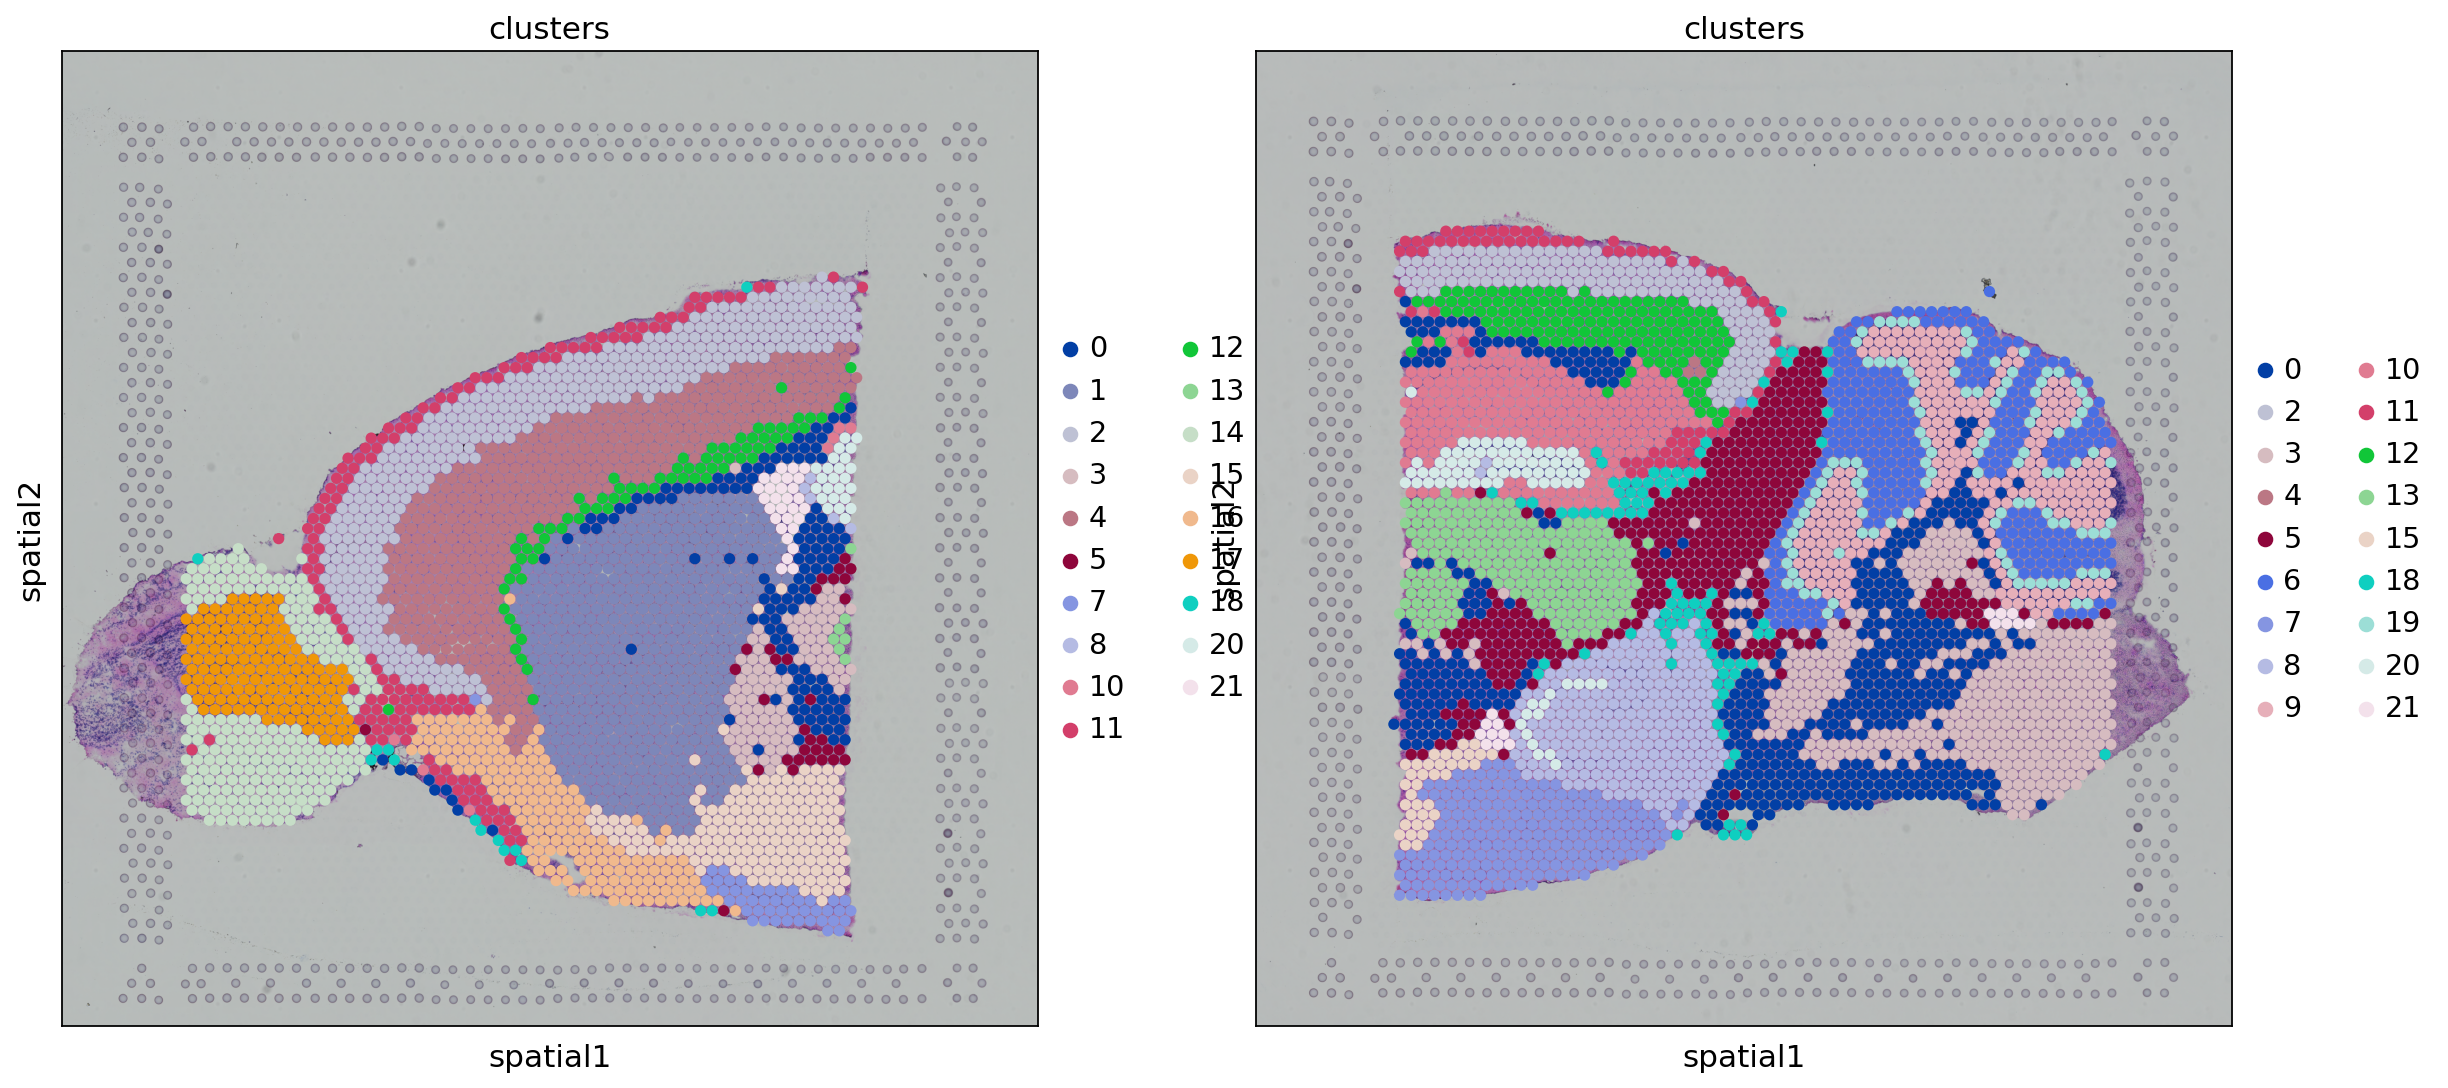
So if I understand correctly, the problem is that if removing [11], you get something like the figure below
 where, e.g., cluster
 1 and 2 share the same color (orange)?
Unfortunately, using scanpy, there's isn't a way to go about this (to my knowledge) without creating the color array for all libraries first.
Using sq.pl.spatial_scatter instead has the same issue, you're constructing the color array for each library separately. Instead, you should run something like
sq.pl.spatial_scatter(
    adata,
    img="hires",
    library_id=["V1_Mouse_Brain_Sagittal_Anterior", "V1_Mouse_Brain_Sagittal_Posterior"],
    library_key='library_id',
    color="clusters",
    size=1.5,
)
which should produce (without running [11] in the original notebook)
Figures size and position differed a lot when setting "img=False", it seems that sq.pl.spatial_scatter doesn't recognize scale_factor ?
According to the help (sq.pl.spatial_scatter):
scale_factor
Scaling factor used to map from coordinate space to pixel space.
Found by default if library_id and img_key can be resolved.
Otherwise, defaults to 1.
But now img_key disappers in sq.pl.spatial_scatter, and is img_res_key a typo ?
Figures size and position differed a lot when setting "img=False", it seems that sq.pl.spatial_scatter doesn't recognize scale_factor ?
when img=FAlse, scale_factor is not used anymore, since it's a simple scatterplot and size changes should be passed explicitly (via size). Maybe it could be explained better in docs indeed...
According to the help (sq.pl.spatial_scatter): scale_factor Scaling factor used to map from coordinate space to pixel space. Found by default if library_id and img_key can be resolved. Otherwise, defaults to 1.
But now img_key disappers in sq.pl.spatial_scatter, and is img_res_key a typo ?
yeah it's a typo, it should just be img. All references of img_key should be replace with img. Would you be up to submit a PR for this fix? thanks for catching it!
I don't know how to submit a PR. When setting "img=False", my picture looks good and the scale_factor is used, but when setting img as default, the figure is not what I expect. I mean sq.pl.spatial_scatter doesn't recognize scale_factor when img=True.
can you provide some examples and the code you are using? also I'd be happy to assist you if you want to learn how to contribute!
Hi, I used the following code (there are four libraries in my anndata object, one library per batch):
In [5]: adata.obs['batch'].value_counts() Out[5]: B1 16439 B2 13333 A1 10008 A2 10497 Name: batch, dtype: int64
In [7]: adata.uns['spatial'].keys() Out[7]: dict_keys(['A1', 'A2', 'B1', 'B2'])
In [8]: sq.pl.spatial_scatter(adata,img="hires",library_id= ['A1', 'A2', 'B1', 'B2'],library_key='batch',color='leiden') This time, the output was not correct, it seemed the scalef_factor was not resolved correctly.
In [9]: sq.pl.spatial_scatter(adata,img=False,library_id= ['A1', 'A2', 'B1', 'B2'],library_key='batch',color='leiden') This time everything was OK, excepting that the HE-stained image could not be shown.
In [9]: sq.pl.spatial_scatter(adata,img=False,library_id= ['A1', 'A2', 'B1', 'B2'],library_key='batch',color='leiden') This time everything was OK, excepting that the HE-stained image could not be shown.
this makes sense, since img=False and therefore mno image is plotted underlying the spots. Is this desired? Only remaining thing is to change the documentation correct?
also, this example should clarify how to plot spatial scatter with multiple library_ids https://squidpy.readthedocs.io/en/stable/auto_examples/plotting/plot_scatter.html
let us know if it helps!
another point:
sq.pl.spatial_scatter(adata,img="hires",library_id= ['A1', 'A2', 'B1', 'B2'],library_key='batch',color='leiden')
here img=True (or leave as default) and if you want to pass hires it needs to be in img_res_key="hires" . Let us know it it works!
It still didn't work, although I can run the example successfully. The four library of my anndata has different size and shape, did it cause the failure ?
here is from help(sq.pl.spatial_scatter): This function has few key assumptions about how coordinates and libraries are handled:
- Coordinates are in the pixel space of the source image, so an equal aspect ratio is assumed.
The four library of my anndata has different size and shape, did it cause the failure ?
mmh it shouldn't be, as long as you have all the relevant metadata in the scalefactors dictionary. It'd be useful if you can share what' the adata looks like (e.g. adata.uns["spatial"]) and which code you are using for plotting.
In [22]: adata = sc.read("scvi_integration/integration.h5ad")
In [23]: sq.pl.spatial_scatter(adata,img=True,img_res_key="hires",library_id= ['A1', 'A2', 'B1', 'B2'],library_key='batch',color=['leiden'])
In [24]: adata.uns['spatial'] Out[24]: {'A1': {'images': {'hires': array([[[1., 1., 1.], [1., 1., 1.], [1., 1., 1.], ..., [1., 1., 1.], [1., 1., 1.], [1., 1., 1.]],
      [[1., 1., 1.],
       [1., 1., 1.],
       [1., 1., 1.],
       ...,
       [1., 1., 1.],
       [1., 1., 1.],
       [1., 1., 1.]],

      [[1., 1., 1.],
       [1., 1., 1.],
       [1., 1., 1.],
       ...,
       [1., 1., 1.],
       [1., 1., 1.],
       [1., 1., 1.]],

      ...,

      [[1., 1., 1.],
       [1., 1., 1.],
       [1., 1., 1.],
       ...,
       [1., 1., 1.],
       [1., 1., 1.],
       [1., 1., 1.]],

      [[1., 1., 1.],
       [1., 1., 1.],
       [1., 1., 1.],
       ...,
       [1., 1., 1.],
       [1., 1., 1.],
       [1., 1., 1.]],

      [[1., 1., 1.],
       [1., 1., 1.],
       [1., 1., 1.],
       ...,
       [1., 1., 1.],
       [1., 1., 1.],
       [1., 1., 1.]]])},
'scalefactors': {'spot_diameter_fullres': 120, 'tissue_hires_scalef': 0.02}}, 'A2': {'images': {'hires': array([[[1., 1., 1.], [1., 1., 1.], [1., 1., 1.], ..., [1., 1., 1.], [1., 1., 1.], [1., 1., 1.]],
      [[1., 1., 1.],
       [1., 1., 1.],
       [1., 1., 1.],
       ...,
       [1., 1., 1.],
       [1., 1., 1.],
       [1., 1., 1.]],

      [[1., 1., 1.],
       [1., 1., 1.],
       [1., 1., 1.],
       ...,
       [1., 1., 1.],
       [1., 1., 1.],
       [1., 1., 1.]],

      ...,

      [[1., 1., 1.],
       [1., 1., 1.],
       [1., 1., 1.],
       ...,
       [1., 1., 1.],
       [1., 1., 1.],
       [1., 1., 1.]],

      [[1., 1., 1.],
       [1., 1., 1.],
       [1., 1., 1.],
       ...,
       [1., 1., 1.],
       [1., 1., 1.],
       [1., 1., 1.]],

      [[1., 1., 1.],
       [1., 1., 1.],
       [1., 1., 1.],
       ...,
       [1., 1., 1.],
       [1., 1., 1.],
       [1., 1., 1.]]])},
'scalefactors': {'spot_diameter_fullres': 120, 'tissue_hires_scalef': 0.02}}, 'B1': {'images': {'hires': array([[[1., 1., 1.], [1., 1., 1.], [1., 1., 1.], ..., [1., 1., 1.], [1., 1., 1.], [1., 1., 1.]],
      [[1., 1., 1.],
       [1., 1., 1.],
       [1., 1., 1.],
       ...,
       [1., 1., 1.],
       [1., 1., 1.],
       [1., 1., 1.]],

      [[1., 1., 1.],
       [1., 1., 1.],
       [1., 1., 1.],
       ...,
       [1., 1., 1.],
       [1., 1., 1.],
       [1., 1., 1.]],

      ...,

      [[1., 1., 1.],
       [1., 1., 1.],
       [1., 1., 1.],
       ...,
       [1., 1., 1.],
       [1., 1., 1.],
       [1., 1., 1.]],

      [[1., 1., 1.],
       [1., 1., 1.],
       [1., 1., 1.],
       ...,
       [1., 1., 1.],
       [1., 1., 1.],
       [1., 1., 1.]],

      [[1., 1., 1.],
       [1., 1., 1.],
       [1., 1., 1.],
       ...,
       [1., 1., 1.],
       [1., 1., 1.],
       [1., 1., 1.]]])},
'scalefactors': {'spot_diameter_fullres': 120, 'tissue_hires_scalef': 0.02}}, 'B2': {'images': {'hires': array([[[1., 1., 1.], [1., 1., 1.], [1., 1., 1.], ..., [1., 1., 1.], [1., 1., 1.], [1., 1., 1.]],
      [[1., 1., 1.],
       [1., 1., 1.],
       [1., 1., 1.],
       ...,
       [1., 1., 1.],
       [1., 1., 1.],
       [1., 1., 1.]],

      [[1., 1., 1.],
       [1., 1., 1.],
       [1., 1., 1.],
       ...,
       [1., 1., 1.],
       [1., 1., 1.],
       [1., 1., 1.]],

      ...,

      [[1., 1., 1.],
       [1., 1., 1.],
       [1., 1., 1.],
       ...,
       [1., 1., 1.],
       [1., 1., 1.],
       [1., 1., 1.]],

      [[1., 1., 1.],
       [1., 1., 1.],
       [1., 1., 1.],
       ...,
       [1., 1., 1.],
       [1., 1., 1.],
       [1., 1., 1.]],

      [[1., 1., 1.],
       [1., 1., 1.],
       [1., 1., 1.],
       ...,
       [1., 1., 1.],
       [1., 1., 1.],
       [1., 1., 1.]]])},
'scalefactors': {'spot_diameter_fullres': 120, 'tissue_hires_scalef': 0.02}}}
it's really interesting, I don't see why it shouldn't work. Re-reading the issue I realized about this:
Figures size and position differed a lot when setting "img=False", it seems that sq.pl.spatial_scatter doesn't recognize scale_factor ?
so when img=True, then the scalefactor is used. If img=False then no scalefactor is used and the image would indeed look different because with img=False it's a simple scatterplot, and not a "circle"plot. If you want the exact same result between img=True and img=False then you'd have to play around with size arg when img=False.
Hope that helps, does it solve the issue?
Yes, I am still looking for some ways to solve the issue, and this is also the case with Napari. Napari can show 10xvisium data correctly, but not my data, the scalefactor cannot be recognized by Napari.
So if I understand correctly, the problem is that if removing
[11], you get something like the figure below1and2share the same color (orange)? Unfortunately, usingscanpy, there's isn't a way to go about this (to my knowledge) without creating the color array for all libraries first. Usingsq.pl.spatial_scatterinstead has the same issue, you're constructing the color array for each library separately. Instead, you should run something likesq.pl.spatial_scatter( adata, img="hires", library_id=["V1_Mouse_Brain_Sagittal_Anterior", "V1_Mouse_Brain_Sagittal_Posterior"], library_key='library_id', color="clusters", size=1.5, )which should produce (without running
[11]in the original notebook)
I saved the cluster colors in a dictionary and visualized the clustering results in spatial coordinates: leiden_colors = dict(zip([str(i) for i in adata.obs.leiden.cat.categories], adata.uns["leiden_colors"])) Is the code right ? I don't know much about the order of the leiden categories and the leiden_colors, do they have the same order ? Becuase I found the following code were different: leiden_colors = dict(zip([str(i) for i in adata.obs.leiden.cat.categories], adata.uns["leiden_colors"])) leiden_colors = dict(zip([str(i) for i in adata.obs.leiden.unique()], adata.uns["leiden_colors"]))
order ? Becuase I found the following code were different: leiden_colors = dict(zip([str(i) for i in adata.obs.leiden.cat.categories], adata.uns["leiden_colors"])) leiden_colors = dict(zip([str(i) for i in adata.obs.leiden.unique()], adata.uns["leiden_colors"]))
yes, this code will give different results, but the way colors are handled are by categories. Is this still an issue?