gt
 gt copied to clipboard
`data_color()` vector applies wrong color
Problem:
To specify colors of a column from another column you can in theory specify an equal length character vector of colors. This works nicely for some examples, but fails under some other constraints.
gt version 0.2.1
library(gt)

# create a tibble of letters, numbers
# and a column to "scale" or generate the colors from

dfx <- dplyr::tibble(
  text = letters[1:5],
  numbers = 1:5,
  scale = c(1,2,3,2,1)
)

dfx

#    # A tibble: 5 x 3
#     text  numbers scale
#    <chr>   <int>  <dbl>
#   1 a         1     1
#   2 b         2     2
#   3 c         3     3
#   4 d         4     2
#   5 e         5     1

# create a vector of colors to apply the color from
# should be c(red, blue, green, blue, red)

col_all <- (scales::col_factor(
    palette = c("red", "blue", "green"),
    domain = NULL)(dfx$scale))

scales::show_col(col_all)

# Apply the colors via data_color()
dfx %>%
  gt() %>%
  # expected colors
  data_color(
    columns = "text",
    colors = col_all
  ) %>%
  # expected colors
  data_color(
    columns = "numbers",
    colors = col_all
  ) %>%
  # applies incorrect color for rows 3, 4, and 5
  data_color(
    columns = "scale",
    colors = col_all
  )

Shoot, I led you astray.
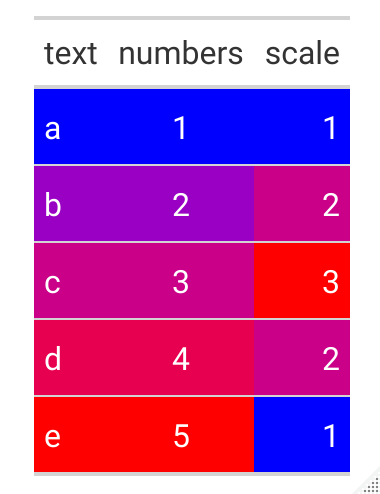
The colors parameter in data_color doesn't work the way I implied on Slack. You cannot pass a vector of colors and expect them to be applied to the cells in the specified order. Instead, when you pass a vector of colors it means "these are colors I'd like to use, do something sensible with them". For numeric columns, that means "use these colors to form a numeric color scale (scales::col_numeric) and then apply that scale to the cell values"; for characters and factors, it means the same thing but with scales::col_factor.
dfx %>% gt() %>% data_color(columns = TRUE, colors = c("blue", "red"))
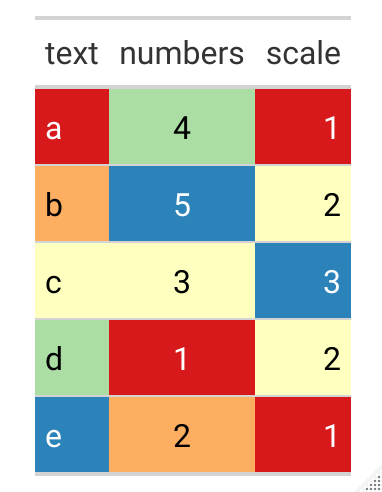
That the "text" and "numbers" columns even looked the same is just a coincidence due to the particulars of this example. Here I've modified the example slightly:
library(gt)

dfx <- dplyr::tibble(
  text = letters[1:5],
  numbers = sample.int(5, 5),
  scale = c(1,2,3,2,1)
)

# RColorBrewer::brewer.pal(5, "Spectral")
colors <- c("#D7191C", "#FDAE61", "#FFFFBF", "#ABDDA4", "#2B83BA")

gt(dfx) %>%
  data_color(columns = TRUE, colors = colors)
It would be totally reasonable to ALSO have a way to specify the colors directly. Either through a new data_color_manual function, or a new parameter to data_color that is mutually exclusive to the color parameter, or a new parameter that modifies the interpretation of color, etc.
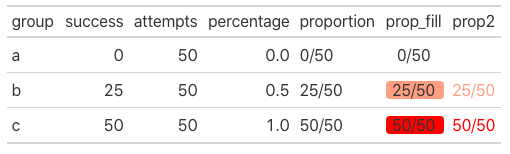
Just as an aside - you can accomplish this upstream of gt by building your own HTML. Probably not ideal, but it's possible today without any changes to gt.
Inspired by Christophe's example on Community. Technically the fill is also a HTML created color-bar inspired from formattable.
library(dplyr)
library(gt)

dat <- tibble(
  group = c("a","b","c"),
  success = c(0, 25, 50),
  attempts = c(50, 50, 50)
) %>%
  mutate(
    percentage = success / attempts,
    proportion = paste(success, attempts, sep = "/")
  )

dat %>%
  mutate(
    color = scales::col_numeric(c("white", "red"), domain = c(0,1))(percentage),
    prop_fill = glue::glue('<span style=\"display: inline-block; direction: ltr; border-radius: 4px; padding-right: 2px; background-color: {color}; width: 100%\"> {proportion} </span>'),
    prop_color = glue::glue('<span style="color:{color}"> {proportion} </span>'),
    prop_fill = map(prop_fill, ~gt::html(as.character(.x))),
    prop_color = map(prop2, ~gt::html(as.character(.x)))
    ) %>%
  select(-color) %>%
  gt()