pygount

pygount copied to clipboard
Add graph for git tags
Goals
- [ ] When a user specifies the command lines option
--format=graph, the output is an image file showing how the SLOC changed over time for each git tag.- [ ] If the command line options for the source path are anything but a single git URL, pygount fails with the error:
--graphrequires a single git URL as source - [ ] The output image format is PNG.
- [ ] The command line option
--tags=REGEXallows to limit the tags to be analyzed to the ones matching the regular expressionREGEX. The default is.*. - [ ] The order of tags to be analyzed is natural.
- ℹ️ Use for example natsort.
- ℹ️ This works best with semantic versioning.
- [ ] The command line option allows to specify the colors for the most popular languages as comma separated list of hex codes with white space and
#being ignored. ℹ️ For example:#123456, 789abc- [ ] The default is ❓ TBD: Use 8 colors that look "nice" but also alternate between bright and dark to make them easy to distinguish even for people with color deficiencies.
- [ ] If less than 2 colors are specified, the option is rejected with the message:
At least two colors must be specified.
- [ ] If there are more languages than colors, the last color is used to sum up the additional languages as "Other".
- [ ] The "Other" languages are always the bottom language, even if in sum they have more lines of code than the separate languages.
- [ ] If there are more colors than languages, only the required number of colors shows in the graph.
- [ ] ❓ TBD: How to handle a language that was part of the repo at some point but is not at the most version. For example:
*.rstis migrated to*.md.
- [ ] In the graph, the languages are sorted in descending order from top to bottom by number of lines at the time of the final tag.
- [ ] If lines numbers are equal, the secondary sort criteria is the display name of language.
- [ ] The command line option
--widthand--heightspecify the size of the graph in pixels.-
[ ] The defaults are 1024 resp. 768.
-
[ ] If the value is less than than 600 resp. 400 or more than 32,767, it is rejected with the message:
Value for option
--xxxmust be between XXX and 32767.Note: PNG could use sizes up to 2**31 - 1.
-
- [ ] ❓ TBD: General layout, percentage used, maximum length of language before cut off, font to use, how to scale font, ...
- [ ] If the command line options for the source path are anything but a single git URL, pygount fails with the error:
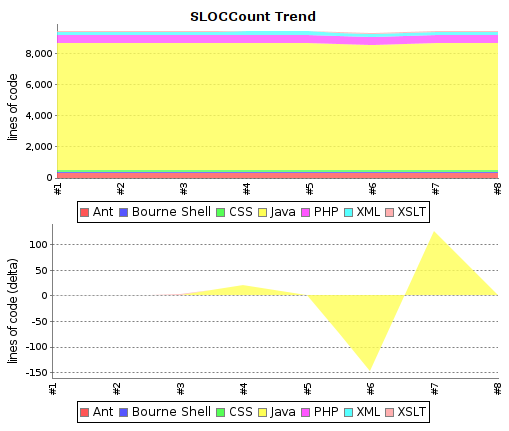
Wireframe
Notes
The idea is to have graphs similar to the Jenkins SlocCount pluggin:
@ropapermaker Assuming you are not going to finish this any more, I'm putting it back to the backlog so it can be revisited again in the future.