discussions-and-proposals
 discussions-and-proposals copied to clipboard
Debugging React Native
This issue is part of What do you dislike about React Native?.
The second most voted answer was that debugging React Native is painful, see https://github.com/react-native-community/discussions-and-proposals/issues/64#issuecomment-444777954.
The problem statement is very broad ("Debugging is hard") and we would like to gather more context about the actual issues that people are experiencing. Please use this issue to list every piece of content you can related to debugging React Native: your own stories, links to issues, blog posts, complaints or any other rants you can find. Thank you!
Systrace - Issue #15003
Systrace is one useful tool which has been broken in the open source release for 1.5 years now with no available fix or workaround.
Initially it was due to the change away from RCTBatchedBridge (workaround here), however, now that it has been removed completely there is no workaround. Another workaround which was given was to use the Chrome debugger, however, this is not the same sort of tool.
The actual issue is that Facebook's fork of React Native has a private library which allows Systrace to work. @gaearon originally posted that it would be looked at in December 2017 or January 2018. In August 2018 @axemclion confirmed that this was not an issue for the internal Facebook version. The proposed solution was for the community to submit a PR on top of an unspecified "very old" PR.
It's a tool that you don't need to use too often, but that fact that it is included in the development menu but has been completely broken for 1.5 years is not a good situation to be in.
As @jamesreggio stated, the community ideally should have stepped up to fix this, however, it would likely take a non-trivial amount of time and could conflict with Facebook's internal tool which would lead to any PR opened to fix the issue being a real slog to get merged (even more than usual). For me, the obvious solution is for Facebook to submit their implemrntation to the open source project, however, it's not clear if that is allowed to happen.
Hi,
For me the issue I get the most is "unactionnable stacktraces"

Usually when having a stacktrace, we can click a stack item and be lead to the original place of the exception. But very often, the stacktrace of uncaught exceptions, or exceptions received in error boundaries are totally unhelpful. It looks to me at some point the stacktrace is lost. If I put a try/catch in render, I'll get the correct stacktrace, but if the exception propagates to upper levels it is lost.
I'd like that an exception thrown in render, and logged in componentDidCatch, to have the same stacktrace as the if I put a try/catch in render myself. ie: clicking on the first stacktrace item would lead to the root cause.
I sometimes get crashes when opening the app that don't result in red screens. These can be caused by configuration of native code, and I end up having to open logcat for Android or Xcode to read what the native-level logs are telling me. Since that info already exists, it'd be nice to have an easier way to access it than by actually opening logcat or Xcode.
Separately, regarding stack traces, it seems that I don't reliably get line numbers, or at least the line numbers are unhelpful. Sometimes I just get a reference to the bundle file. As in @slorber 's screen shot, ExceptionsManager.js or MessageQueue.js or debuggerWorker.js come up in stack traces all the time, but are never helpful for figuring out what the error was. To clarify, every line of that stack trace refers to the code that is handling the thrown error internally within react-native, not to where the error originated in our code.
Along with that, cannot read property x of undefined errors are pretty common, and it would be very nice to know which variable, or which object property was actually undefined.
Debugging network requests feels kludgy. There are lots of different solutions, but nothing standardized.
Hot reloading is awesome, but is not working as good as it could (actually it is even crashing for me on iOS if I am not debugging).
Dan Abramov had a real good blog post about what would make hot reloading great (also makes a point that rn implementation is not complete): https://overreacted.io/my-wishlist-for-hot-reloading/
When debugging the app in iOS, the number of times that I get a red error screen telling me that the package server is not ready for debugging, when it absolutely is, is very frustrating, especially if it happens during the testing of a sequence of events and reloading the view takes me back to the beginning of the sequence. Often my only option is to restart the application and hope that it works better next time.
To second that, often it will remain on "not ready for debugging" directly after telling it to debug JS remotely - I'm guessing because the server is in the process of launching. You have to refresh again for it to actually connect.
This issue seems to persist in the wild; https://github.com/facebook/react-native/issues/12830 It is related to AsyncStorage blocking (not resolving) during debug sessions on iOS/Android device/emulator/simulator and variants. I personally have not experienced it recently.
An ongoing bug which I'm getting really highlights how inadequate React Native's tooling is when it comes to figuring out where a native crash originates in your JS code. Let me outline the issue and point out the debugging pain points.
The Android crash report shows the following:
Fatal Exception: com.facebook.react.bridge.JSApplicationIllegalArgumentException: Error while updating property 'transform' of a view managed by: RCTView
       at com.facebook.react.uimanager.ViewManagersPropertyCache$PropSetter.updateViewProp(ViewManagersPropertyCache.java:95)
       at com.facebook.react.uimanager.ViewManagerPropertyUpdater$FallbackViewManagerSetter.setProperty(ViewManagerPropertyUpdater.java:132)
       at com.facebook.react.uimanager.ViewManagerPropertyUpdater.updateProps(ViewManagerPropertyUpdater.java:51)
       at com.facebook.react.uimanager.ViewManager.updateProperties(ViewManager.java:32)
       at com.facebook.react.uimanager.NativeViewHierarchyManager.updateProperties(NativeViewHierarchyManager.java:138)
       at com.facebook.react.uimanager.UIViewOperationQueue$UpdatePropertiesOperation.execute(UIViewOperationQueue.java:95)
       at com.facebook.react.uimanager.UIViewOperationQueue$1.run(UIViewOperationQueue.java:894)
       at com.facebook.react.uimanager.UIViewOperationQueue.flushPendingBatches(UIViewOperationQueue.java:1001)
       at com.facebook.react.uimanager.UIViewOperationQueue.access$2400(UIViewOperationQueue.java:46)
       at com.facebook.react.uimanager.UIViewOperationQueue$DispatchUIFrameCallback.doFrameGuarded(UIViewOperationQueue.java:1061)
       at com.facebook.react.uimanager.GuardedFrameCallback.doFrame(GuardedFrameCallback.java:29)
       at com.facebook.react.modules.core.ReactChoreographer$ReactChoreographerDispatcher.doFrame(ReactChoreographer.java:134)
       at com.facebook.react.modules.core.ChoreographerCompat$FrameCallback$1.doFrame(ChoreographerCompat.java:105)
       at android.view.Choreographer$CallbackRecord.run(Choreographer.java:909)
       at android.view.Choreographer.doCallbacks(Choreographer.java:723)
       at android.view.Choreographer.doFrame(Choreographer.java:655)
       at android.view.Choreographer$FrameDisplayEventReceiver.run(Choreographer.java:897)
       at android.os.Handler.handleCallback(Handler.java:789)
       at android.os.Handler.dispatchMessage(Handler.java:98)
       at android.os.Looper.loop(Looper.java:164)
       at android.app.ActivityThread.main(ActivityThread.java:6694)
       at java.lang.reflect.Method.invoke(Method.java)
       at com.android.internal.os.Zygote$MethodAndArgsCaller.run(Zygote.java:240)
       at com.android.internal.os.ZygoteInit.main(ZygoteInit.java:769)
Caused by java.lang.reflect.InvocationTargetException java.lang.reflect.Method.invoke
Caused by java.lang.reflect.InvocationTargetException
       at java.lang.reflect.Method.invoke(Method.java)
       at com.facebook.react.uimanager.ViewManagersPropertyCache$PropSetter.updateViewProp(ViewManagersPropertyCache.java:83)
       at com.facebook.react.uimanager.ViewManagerPropertyUpdater$FallbackViewManagerSetter.setProperty(ViewManagerPropertyUpdater.java:132)
       at com.facebook.react.uimanager.ViewManagerPropertyUpdater.updateProps(ViewManagerPropertyUpdater.java:51)
       at com.facebook.react.uimanager.ViewManager.updateProperties(ViewManager.java:32)
       at com.facebook.react.uimanager.NativeViewHierarchyManager.updateProperties(NativeViewHierarchyManager.java:138)
       at com.facebook.react.uimanager.UIViewOperationQueue$UpdatePropertiesOperation.execute(UIViewOperationQueue.java:95)
       at com.facebook.react.uimanager.UIViewOperationQueue$1.run(UIViewOperationQueue.java:894)
       at com.facebook.react.uimanager.UIViewOperationQueue.flushPendingBatches(UIViewOperationQueue.java:1001)
       at com.facebook.react.uimanager.UIViewOperationQueue.access$2400(UIViewOperationQueue.java:46)
       at com.facebook.react.uimanager.UIViewOperationQueue$DispatchUIFrameCallback.doFrameGuarded(UIViewOperationQueue.java:1061)
       at com.facebook.react.uimanager.GuardedFrameCallback.doFrame(GuardedFrameCallback.java:29)
       at com.facebook.react.modules.core.ReactChoreographer$ReactChoreographerDispatcher.doFrame(ReactChoreographer.java:134)
       at com.facebook.react.modules.core.ChoreographerCompat$FrameCallback$1.doFrame(ChoreographerCompat.java:105)
       at android.view.Choreographer$CallbackRecord.run(Choreographer.java:909)
       at android.view.Choreographer.doCallbacks(Choreographer.java:723)
       at android.view.Choreographer.doFrame(Choreographer.java:655)
       at android.view.Choreographer$FrameDisplayEventReceiver.run(Choreographer.java:897)
       at android.os.Handler.handleCallback(Handler.java:789)
       at android.os.Handler.dispatchMessage(Handler.java:98)
       at android.os.Looper.loop(Looper.java:164)
       at android.app.ActivityThread.main(ActivityThread.java:6694)
       at java.lang.reflect.Method.invoke(Method.java)
       at com.android.internal.os.Zygote$MethodAndArgsCaller.run(Zygote.java:240)
       at com.android.internal.os.ZygoteInit.main(ZygoteInit.java:769)
Caused by com.facebook.react.bridge.NoSuchKeyException: translateX
Caused by com.facebook.react.bridge.NoSuchKeyException: translateX
       at com.facebook.react.bridge.ReadableNativeMap.getValue(ReadableNativeMap.java:122)
       at com.facebook.react.bridge.ReadableNativeMap.getValue(ReadableNativeMap.java:126)
       at com.facebook.react.bridge.ReadableNativeMap.getDouble(ReadableNativeMap.java:168)
       at com.facebook.react.uimanager.TransformHelper.processTransform(TransformHelper.java:82)
       at com.facebook.react.uimanager.BaseViewManager.setTransformProperty(BaseViewManager.java:213)
       at com.facebook.react.uimanager.BaseViewManager.setTransform(BaseViewManager.java:69)
       at java.lang.reflect.Method.invoke(Method.java)
       at com.facebook.react.uimanager.ViewManagersPropertyCache$PropSetter.updateViewProp(ViewManagersPropertyCache.java:83)
       at com.facebook.react.uimanager.ViewManagerPropertyUpdater$FallbackViewManagerSetter.setProperty(ViewManagerPropertyUpdater.java:132)
       at com.facebook.react.uimanager.ViewManagerPropertyUpdater.updateProps(ViewManagerPropertyUpdater.java:51)
       at com.facebook.react.uimanager.ViewManager.updateProperties(ViewManager.java:32)
       at com.facebook.react.uimanager.NativeViewHierarchyManager.updateProperties(NativeViewHierarchyManager.java:138)
       at com.facebook.react.uimanager.UIViewOperationQueue$UpdatePropertiesOperation.execute(UIViewOperationQueue.java:95)
       at com.facebook.react.uimanager.UIViewOperationQueue$1.run(UIViewOperationQueue.java:894)
       at com.facebook.react.uimanager.UIViewOperationQueue.flushPendingBatches(UIViewOperationQueue.java:1001)
       at com.facebook.react.uimanager.UIViewOperationQueue.access$2400(UIViewOperationQueue.java:46)
       at com.facebook.react.uimanager.UIViewOperationQueue$DispatchUIFrameCallback.doFrameGuarded(UIViewOperationQueue.java:1061)
       at com.facebook.react.uimanager.GuardedFrameCallback.doFrame(GuardedFrameCallback.java:29)
       at com.facebook.react.modules.core.ReactChoreographer$ReactChoreographerDispatcher.doFrame(ReactChoreographer.java:134)
       at com.facebook.react.modules.core.ChoreographerCompat$FrameCallback$1.doFrame(ChoreographerCompat.java:105)
       at android.view.Choreographer$CallbackRecord.run(Choreographer.java:909)
       at android.view.Choreographer.doCallbacks(Choreographer.java:723)
       at android.view.Choreographer.doFrame(Choreographer.java:655)
       at android.view.Choreographer$FrameDisplayEventReceiver.run(Choreographer.java:897)
       at android.os.Handler.handleCallback(Handler.java:789)
       at android.os.Handler.dispatchMessage(Handler.java:98)
       at android.os.Looper.loop(Looper.java:164)
       at android.app.ActivityThread.main(ActivityThread.java:6694)
       at java.lang.reflect.Method.invoke(Method.java)
       at com.android.internal.os.Zygote$MethodAndArgsCaller.run(Zygote.java:240)
       at com.android.internal.os.ZygoteInit.main(ZygoteInit.java:769)
For iOS, in release mode, it doesn't actually crash the app. But for some reason, the interface freezes up and doesn't respond well, or unexpected things happen when you tap buttons. However, I can sometimes replicate the crash locally, and the Xcode log says:
-[NSNull floatValue]: unrecognized selector sent to instance 0x112e63f28
The redscreen crash that shows up in the simulator indicates that translateX has been given the value null, and that isn't allowed. This is basically the same as what shows up in the Android emulator too. Sometimes these crashes also indicate the View ID (e.g. "View with ID #777" or something like that).
So far in the debugging experience, I know that a crash happens, and that it's caused because at some point translateX is set to null. So I know that this is a UI rendering issue because this is a style property. However, there is no indication of where this crash happens or what user behavior causes it because it doesn't happen every time you run the app.
After further investigation, I found that it typically happens after a particular action happens. So now I can reproduce it in a simulator fairly regularly (though still not 100% reliably). At this point, I need to figure out where translateX is getting improperly set. So I do a global search for translateX. I find out the following:
- I never use
translateXin my own code. So it is caused by a 3rd party library. - The word
translateXoccurs 221 times in node_modules. So figuring out which one causes it will be difficult.
My next thought with debugging was to set a breakpoint in Xcode whenever any exception happens, so I can see much more detailed information about the crash. This worked really well, I was able to examine the call stack and local variables for the entire crash.
However, the call stack was entirely internal react-native code. Since the transform values are obviously sent over the JS bridge, after it gets into the native code, everything is handled by fairly generic code which runs on every translateX set. A lot of this code also handles any style property.
Natively debugging the crash only showed me the local variables for native code - but it was impossible to figure out which of this code ties back to my JS code. I need to know which component it originates from in order to fix it or to file a bug report. The most I could find out after some digging through the stack trace was the backgroundColor of the view, and the "pseudo ID" of the view. I used react-native-debugger to look through the React views of my app, but that doesn't show any sort of ID for the views, so I still can't figure out which view causes the issue.
While setting a breakpoint in the native code, I pulled out the data structure which contains the null value. It looks like this:

I'm not sure why null was never validated before it got to the point in native code where it tried to apply the transform logic to the values. Seems like it should have been.
Doing a bit more thought, my next hunch is based on the fact that the action sets particular redux state that re-renders a component. And that component would not be visible when the redux state updates. Thinking about the components that would update, I narrowed my search for translateX to a react-native-progress, and found a bit of code in react-native-progress/Bar.js which calls translateX, and also looks surprisingly similar to the data structure which causes the issue:
    const progressStyle = {
      backgroundColor: color,
      height,
      transform: [
        {
          translateX: this.state.animationValue.interpolate({
            inputRange: [0, 1],
            outputRange: [innerWidth * -INDETERMINATE_WIDTH_FACTOR, innerWidth],
          }),
        },
        {
          translateX: this.state.progress.interpolate({
            inputRange: [0, 1],
            outputRange: [innerWidth / -2, 0],
          }),
        },
        {
          // Interpolation a temp workaround for https://github.com/facebook/react-native/issues/6278
          scaleX: this.state.progress.interpolate({
            inputRange: [0, 1],
            outputRange: [0.0001, 1],
          }),
        },
      ],
    };
This array is set up with the same order and same properties that the object which causes the issue has been. That's really encouraging. But now I need to figure out why any of those values would ever be set to null.
So I set console.log() in the progress library for each of the array elements, like:translateX.__getValue(), expecting to see something fishy when triggering the crash. But the values are 100% normal up to the crash, and nothing looks weird at the time of the crash.
So at this point I've been investigating this crash for more than 20 hours, and the existing similar issues and Stack Overflow posts are rare and unhelpful.
I've outlined this debugging experience so that you have some more material examples of how difficult it can be to debug React Native issues. Here are my big takeaways:
- Native crashes almost never include the information necessary to tie the crash back to the JS code you wrote that causes the issue.
- While debugging, it's not possible to look at a native function which has been called from JS and see which React view or component it is operating on.
- The native call stack is basically a chain of functions in which 80% of them have to do with internal rendering stuff which is rarely at fault for these sorts of issues. Obviously, that's just how the code is written so there's not much to change, but it means that the given information is really inadequate.
Basically, I think my conclusion is that there has to be some easy way to debug through the JS bridge such that internal React Native functions that actually do the bridge work are hidden. For example, I would rarely want to have any information about the internal functions which actually implement the bridge on both the JS and Native sides. But as is, the majority of debug information is just printing out the internal bridge implementation and view updating code. What we need to know is what JS file this error originated from, and how it propagated through our own code, or through a 3rd party library's code, in order to end up in a bad state.
It definitely seems like a really tough problem to solve, so I hope this post has been helpful, though it is quite long. Happy Holidays! :)
P.S. If you have any suggestions for actually fixing this dang crash, please let me know!
@noahtallen thank you so much for that level of detail. It is amazingly helpful and really shows the scope of the problem, especially when dealing with 3rd party code. This is definitely something we will need to talk about as a group.
Systrace is one useful tool which has been broken in the open source release for 1.5 years now with no available fix or workaround.
@matt-oakes Have you tried the Javascript Profiler in the standalone React Native Debugger? You can select the debug worker thread to make flame charts of JS calls. I use it a lot to find out why the JS thread is not keeping up. I find that using the javascript profiler, combined with Android systrace and various iOS Instruments, is a decent workaround to get insight in what is slowing down any app.
I agree Systrace should be fixed of course.
When you make a change to a file in your bundle and restart your app (either from Xcode or via the "Reload JS" button), breakpoints in Chrome devtools are not respected. This might be because it takes time for Chrome devtools to process the source map. It would be great if the RN team looked into it!
Hey everyone! Thanks so much for participating in this discussion so far. I think we have a good understanding of things that are broken. I'm interested in fixing a ton of the smaller annoyances, like unhelpful error messages. A lot of you have been sharing error messages but no clear repros. Would you mind sending me your best code examples that I can just drop into my App.js of a new RN app that will either crash, generate an unhelpful error or otherwise cause trouble that you think needs attention? Thank you!
Here's one: Unhandled Promise Rejections have unhelpful stack traces, @cpojer. We deal with this a lot.
import React, {Component} from 'react';
import {Text, View} from 'react-native';

export default class App extends Component {
  componentDidMount() {
    async function crash() {
      throw new Error('crashed')
    }
    crash()
  }

  render() {
    return <View><Text>Jamon</Text></View>;
  }
}

My app got this issue on Sentry Invariant Violation: Text strings must be rendered within a <Text> component., I spent a few days to find the cause but I couldn't, then my team come with a solution that set display name for every component, any suggestions to discover the cause?
@namvoeh you must wrap your strings in Text component to solve your issue.
You can see the origin of your error from the screenshot below.
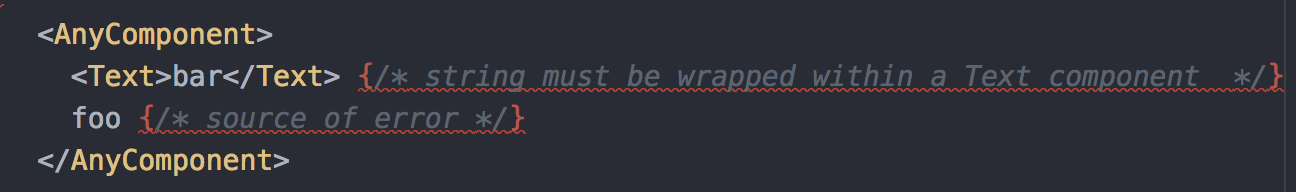
@h4run yup, the pic shows correct issue, my problem is I got this issue from Sentry instead in debug mode, so it's hard to find the cause
@namvoeh
How can you render your component? Rendering based on condition like { condition && <Component /> } usage may occur that error in runtime. Here are expo code.
Cause is empty string ('') and zero (0)
// Invariant Violation Error
const Foo = () => (
  <View>
    { '' && <Bar /> }  // if value is empty string
    { 0 && <Bar /> } // if value is zero
  </View>
)

const Foo = () => (
  <View>
    { value ? <Bar /> : null }  // 1. use ternary operator
    { !!value && <Bar /> }  // 2. use !! expression to make it boolean value
  </View>
)
I hope this will help you 😃
There are places in code does 1. use ternary operator, it leads to the issue, when the value is '' or 0, the point I want to say is when there is an issue, it's hard to debug. Currently, my team set display name for all component, hope that it gives us evidence to fix this bug
Thanks for participating in the discussion. Please do not discuss how to solve specific problems here as it's not a support forum. I'm looking for concrete code examples that lead to bad errors or crashes. Screenshots of issues without repro steps are unfortunately not really actionable.
My biggest gripe is that debugger stops are not working correctly. They are always on the wrong line. Forcing the use of debugger.
fetch() to external API when the device has no internet just crashed the app. I had to use axios for this purpose or check the internet connection before every call. Checking the internet and showing "no internet connection" is a developer choice but I feel like there is a better way to handle fetch call? Just a suggestion and please let us know if there is a better and best practice to handle this. Thanks.
Often we have to inspect network request payloads to debug app problems.
But the requests do not show up in remote debugger.
It would be very useful to enable simple logging of all requests/responses in DEV easily.
This is already possible in userland (axios has interceptors and you can wrap fetch yourself) but for me the need is important and I keep adding this logging in any app I work with
The logging could be activated by a call on app startup. It could be more verbose and with some styling/colors when in chrome debugger, and less verbose when logging to terminal (large payloads tend to crash)
I'd be happy to work on this if the idea seems good to you
Sure. :) Anything to improve the process would be good. Moreover, I think I was using 0.57 for awhile and it is okie. Now when I upgraded to 0.59.4, fetch call without internet crashes the app. I am not sure if it is happening only to me or intended design.
Often we have to inspect network request payloads to debug app problems. But the requests do not show up in remote debugger. It would be very useful to enable simple logging of all requests/responses in DEV easily. This is already possible in userland (axios has interceptors and you can wrap fetch yourself) but for me the need is important and I keep adding this logging in any app I work with The logging could be activated by a call on app startup. It could be more verbose and with some styling/colors when in chrome debugger, and less verbose when logging to terminal (large payloads tend to crash) I'd be happy to work on this if the idea seems good to you Le jeu. 11 avr. 2019 à 04:19, Aung Myint Thein [email protected] a écrit : … fetch() to external API when the device has no internet just crashed the app. I had to use axios for this purpose or check the internet connection before every call. Checking the internet and showing "no internet connection" is a developer choice but I feel like there is a better way to handle fetch call? Just a suggestion and please let us know if there is a better and best practice to handle this. Thanks. — You are receiving this because you were mentioned. Reply to this email directly, view it on GitHub <#69 (comment)>, or mute the thread https://github.com/notifications/unsubscribe-auth/AAtvPqq-jWJYYZYAGuJYZsPHXWWtvWtDks5vfpuvgaJpZM4ZMzgd .
@slorber Use react-native-debugger. Right mouse click => Enable Network Inspect. Tadaaa!
I'd like to reiterate what @cpojer said above. We are looking for specific things that we can easily repro to improve error messages. @jamonholmgren's post is exactly what we are looking for: https://github.com/react-native-community/discussions-and-proposals/issues/69#issuecomment-481482095
Unfortunately, anything other than that is not very actionable for us.
I've got another to add courtesy of @jmeistrich:
On Android, a timeout set to undefined:
var xhr = new XMLHttpRequest();
xhr.timeout = undefined;
xhr.open('GET', 'http://facebook.com');
xhr.send();
leads to the error:
error: Attempt to invoke virtual method 'double java.lang.Double.doubleValue()
The stack trace in the error isn't helpful. (I don't have a screenshot of the redbox from them)
As @TheSavior mentioned, having an undefined timeout on XMLHttpRequest causes a native crash only on Android. The stack trace is useless, and the crash happens asynchronously so stepping through until it crashes doesn't work. The only way I managed to track it down was to comment code until it stopped crashing.

When forgot using Animated.View:
Error while updating property '<prop_name>' in shadow node of type: RCTView

null

Value for width cannot be cast from ReadableNativeMap to Double
updateShadowNodeProp
    ViewManagersPropertyCache.java:116
setProperty
    ViewManagerPropertyUpdater.java:157
updateProps
    ViewManagerPropertyUpdater.java:61
updateProperties
    ReactShadowNodeImpl.java:292
createView
    UIImplementation.java:295
createView
    UIManagerModule.java:462
invoke
    Method.java
invoke
    JavaMethodWrapper.java:372
invoke
    JavaModuleWrapper.java:158
run
    NativeRunnable.java
handleCallback
    Handler.java:873
dispatchMessage
    Handler.java:99
dispatchMessage
    MessageQueueThreadHandler.java:29
loop
    Looper.java:193
run
    MessageQueueThreadImpl.java:232
run
    Thread.java:764