quick-lint-js
 quick-lint-js copied to clipboard
40$: Graph CI build times
Make it easier to isolate build time regressions by graphing build times on CI over time.
There are a few routes that we can take for this, I couldn't find any tools with my initial google search that do this for free. Github does have an API that is pretty accessible.
I made a POC repo here that generates graphs from workflow build times using their API.
3 routes we could take..
- generate these graphs triggered from a webhook attached to the action workflows then output to a filesystem on web-server
- build a web app that generates these graphs (this would require implementing Github's auth flow on our web app) every-time we visit it.
- new workflow in the repo that outputs graphs to Github pages.
Let me know what you think.
I made a POC repo here that generates graphs from workflow build times using their API.
Thanks for the prototype!
3 routes we could take..
Another approach: Sync data to .json/.csv files somehow, then later generate the graphs from these .json/.csv files.
generate these graphs triggered from a webhook attached to the action workflows then output to a filesystem on web-server
If we do this request from each workflow, then we can't get an accurate total job time (because the web request changes how long a job takes). The effect should be minor, though, and not a major impact if we measure each step too.
build a web app that generates these graphs (this would require implementing Github's auth flow on our web app) every-time we visit it.
In the web UI, I can only go back 100 pages. (Page 101 gives a 404 error.) If the API is similarly limited, then we won't have a long history of data to draw from. (Page 100 goes back only a month or two.) So we'd probably need to keep our own copy of the data to observe longer-term trends.
new workflow in the repo that outputs graphs to Github pages.
This would work well if we trigger it on a regular schedule. But the data limit problems I mentioned above might mean we have to have an intermediate database (e.g. .json or .csv files) to generate longer-term graphs.
In the web UI, I can only go back 100 pages. (Page 101 gives a 404 error.) If the API is similarly limited, then we won't have a long history of data to draw from. (Page 100 goes back only a month or two.) So we'd probably need to keep our own copy of the data to observe longer-term trends.
From what I observed in my testing, all of this data is mostly accessible. I say mostly because there are limits on how frequently we can access the data, rather than how much of it (what you are observing on GitHub's web-app might just be a bug with pagination). So maybe we could set-up a poller that writes to blob storage, which can be triggered either on a cadence or possibly a webhook. Then just make a call to this blob storage from a web frontend that generates our graphs.
I might recommend against this approach initially just because we can generate API tokens on a user-by-user basis rather than just once for our tool. Which unless we are sitting there refreshing the page every minute could cause some issue, but even in that case we could just make our web-app progressive and call it a day.
I'm all for working on a spin-off tool that does this, I am mostly free this weekend so just let me know.
I'm willing to sponsor development for this tool if it's usable for more than just quick-lint-js.
Hi, after watching your twitch channel for a couple of days I arrived here.. thanks for your time there, it is great content !!
The main problem with this is the rate limit of the API.
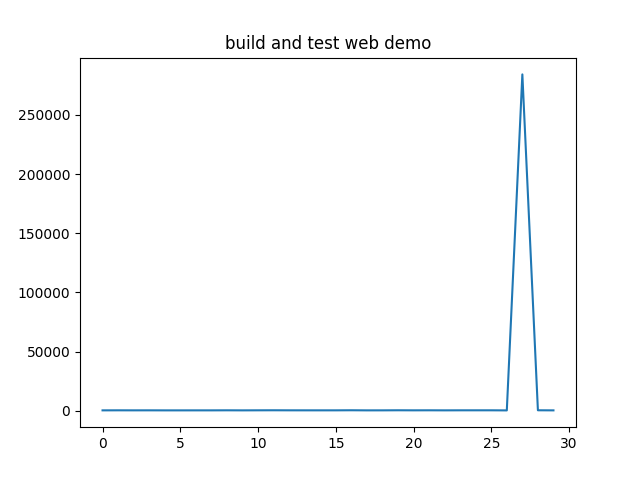
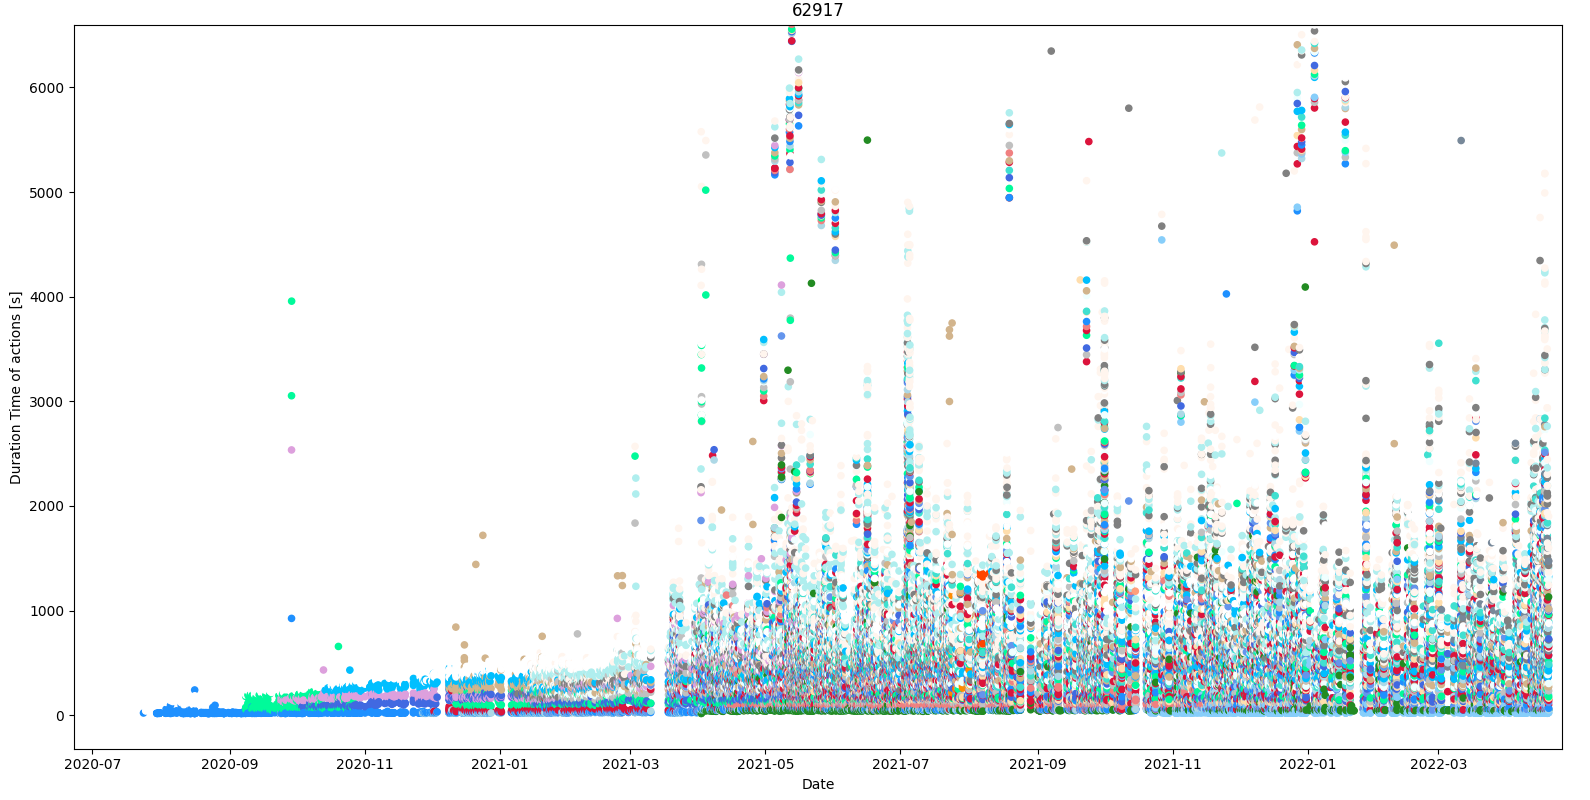
If one request all the data of the workflows runs with the GitHub API (which has a rate limit of 5000 requests per hour local and 1000 request per hour from GitHub actions), it took 30 minutes to get all the runs dumped to JSON files and one get a plot like the following (the different colors are for different names of the runs)
with that initial data for an old repository, one can schedule a daily GitHub action similar to this post
https://codeburst.io/storing-weather-data-daily-using-github-actions-c2b0ed513ca6
maybe with a selector for the different names and to select a different range of time of the plots.
Here below are both scripts used for this
import requests, json
myuser = "myuser"
mytoken = "mytoken"

api_repos = "https://api.github.com/repos/"
user = "quick-lint/"
repo = "quick-lint-js/"

n, page_number = 1, 0
while n:
    address = api_repos + user + repo + "actions/runs?per_page=100&page="+str(page_number)
    workflows = requests.get(address,
                            auth=(myuser,mytoken)
                            ).json().get('workflow_runs')
    for workflow in workflows:
        with open(str(workflow['id'])+'.json','w') as outfile:
             json.dump(workflow, outfile)
    print ('page number is', page_number )
    page_number += 1
    n = len(workflows)
and the plotting
import json, numpy as np
from glob import glob
from datetime import datetime
from matplotlib.figure import Figure
from matplotlib import pyplot as plt
from matplotlib import colors as mcolors
from random import choices


action_names = ['Arch Linux package', 'Arch package',
 'CI self-check',  'CLA',  'Debian package',
 'Homebrew package', 'Manually triggered workflow',
 'build and test', 'build and test Linux Ninja developer instructions',
 'build and test VS Code extension', 'build and test VS Code extension (WASM)',
 'build and test web demo',  'build static',
 'build test dev env nix',  'build unvendored',
 'build wasm',  'build website',
 'check copyright',  'check error docs',
 'check format',  'deploy web demo',
 'deploy web demo (WIP)', 'deploy website',
 'simple build',  'tag build',
 'test Emacs plugin',  'test LSP benchmarks',
 'test Nix install',  'test Vim plugin',
 'test install',  'testm1']
colors = choices(list(mcolors.CSS4_COLORS),k = len(action_names))

toISOformat = lambda x: datetime.fromisoformat(x.replace('T',' ').replace('Z',''))

files = glob('*.json')

dates = []
times = []
names = []
colours = []
for i, fil in enumerate(files):
    if not i%500: print ('itera',i)
    with open(fil) as infile: json_obj = json.load(infile)
    if json_obj.get('conclusion') =='success':
        end_date = toISOformat(json_obj.get('updated_at'))
        if not end_date: continue
        start_date =  toISOformat(json_obj.get('created_at'))
        if not start_date: continue
        dates.append(start_date)
        times.append((end_date - start_date).total_seconds())
        name = json_obj.get('name')
        names.append(name)
        colours.append(colors[action_names.index(name)])

# print (files[np.where(np.array(times)>500000)[0][0]])
dates, times, names, colours = np.array(sorted(zip(dates, times, names, colours ))).T

#%%
fig = plt.figure()
ax = fig.subplots()
ax.set_xlabel('Date')
ax.set_ylabel('Duration Time of actions [s]')

idxs = np.where(names!='action_names[0]')

ax.set_title(str(len(dates)))
ax.scatter(dates[idxs], times[idxs], s = 20, color = colours[idxs])
@nghenzi Do you plan on productionizing your script? different graphing modes; SQL or other updateable database; filtering data by job and by time; outlier analysis; web UI?
Do you know what the time gaps in your data represent? Are they just me not working on quick-lint-js for a while? Or is there an API querying problem (e.g. data lost between pages)?
I do not believe in producing this, I am learning Github actions for now and I will make a little web UI similar to the link in the previous response filtering data by job and by time, not with python but js. The idea is to learn to do all the data fetching automatically, without something local.
The API works great and there is no querying problem, always inside the rate limits. From the 70000 runs of your repository, there are a lot of runs that have conclusion = 'failure' or have start_date or updated_at missing values (almost 10%). I would need a more detailed review of the JSON structure to see the gaps. But for example, from 20210311 to 20210315 there is no data, maybe holidays or not work, and in the failures, there are big outliers like runs with a duration time of 10 days.
I will give this a further look and update advances here.
I built a data collector in commit 31b8fad988668e7fcfa2b958641bb33b2a1ec6d3. It's crappy, really really slow, and hits API limits often. =S
I was able to make some basic graphs locally using Apache Superset.
Perhaps switching to GitLab CI (#778) will make data collection easier. (Maybe GitLab CI even has dashboards built in.)