serve
 serve copied to clipboard
Confused about Cumulative Inference Duration vs. PredictionTime
📚 The doc issue
I am running a model on TorchServe and I am trying to see how long it takes for inference.
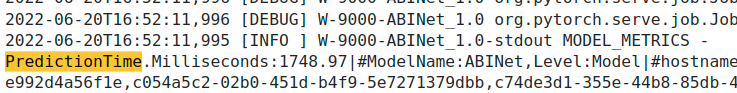
If I use logging and view the logs, then I can see there is something called PredictionTime:
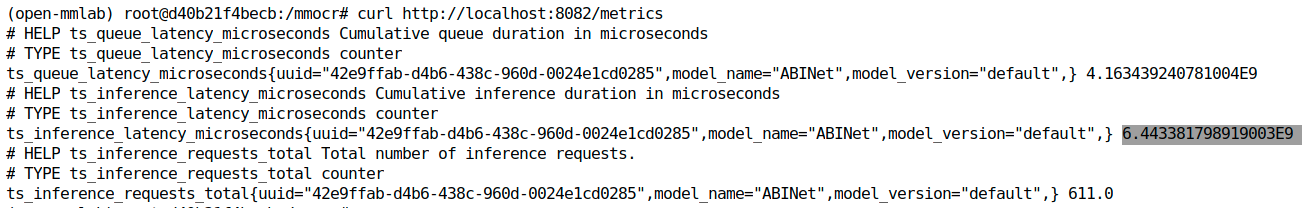
However, if I use the Metrics API, then I got something called "Cumulative Inference Duration"
And in terms of values those 2 are very different. So I am not sure which one should I use to measure the total inference time for my requests?
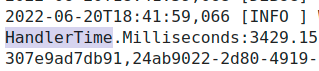
Btw, there is also something else called HandlerTime in the logs
What does it mean? Where can I find related information about what are the meanings of these metrics?
Thanks,
Suggest a potential alternative/fix
No response
Thanks for all the recent feedback @Hegelim - since you're exploring our metrics story I'd recommend you check out our RFC #1492 and provide any feedback there. I agree that right now figuring out what each metric is from source code is not ideal
HandlerTimeis the time it takes to run thehandle()function in the base handler https://github.com/pytorch/serve/blob/master/ts/torch_handler/base_handler.py#L248 so this will be the time you observe your handler take assuming you run it without torchserve so something like #1538 and more importantly this is the time you control depending on how slow/fast your model isPredictionTimeis the time it takes the python backend to run your handler https://github.com/pytorch/serve/blob/master/ts/service.py#L123 so think of this as torchserve overhead from our python codeCumulative inference durationis defined here https://github.com/pytorch/serve/blob/master/frontend/server/src/main/java/org/pytorch/serve/metrics/format/prometheous/PrometheusMetricManager.java#L14-L34 and those are cumulative counters over the number of requests and are defined here https://github.com/pytorch/serve/blob/b11ba0fa97ceea7003bfa7c4fd4203f36fee3d34/frontend/server/src/main/java/org/pytorch/serve/job/RestJob.java#L73-L97 - you can think of these as the end to end overhead including java, python and your handler code
I am still confused - maybe because I am not very versed in Java.
So if I understand you correctly, Cumulative inference duration should be the largest, right? Because it is the end-to-end overhead including everything. However, according to my screenshots above, Cumulative inference duration is much smaller than PredictionTime, the former one is around 6 ms, the latter one is around 3 s.
@Hegelim
- in the model_metrics.log: HandlerTime/PredictionTime: records each individual inference requests latency.
- in metrics API: all of the values (eg. Cumulative Inference Duration) are all inference requests stats results during the time interval calculated by Prometheus.