pymc
 pymc copied to clipboard
Data objects not connected to binomial, Poisson likelihood when parameters have non-scalar shape
Description of your problem
When using Data or MutableData objects with binomial or Poisson likelihoods, they are not properly added to the model graph when the likelihood has non-scalar shapes. For example, this works fine:
Please provide a minimal, self-contained, and reproducible example.
import pymc as pm
import numpy as np
with pm.Model() as m:
    # Initialize with dummy values
    X = pm.MutableData("X", np.empty(3))

    mu = pm.Exponential('mu', 5)
    theta_like = pm.Poisson(
        "theta_like",
        mu=mu,
        observed=X,
    )

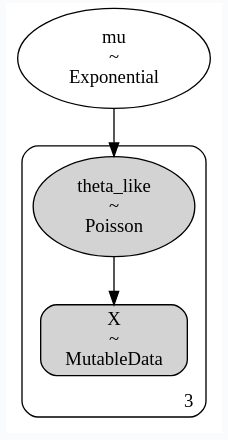
Yet giving mu a non-scalar shape breaks the model graph:
import pymc as pm
import numpy as np
with pm.Model() as m:
    # Initialize with dummy values
    X = pm.MutableData("X", np.empty(3))

    mu = pm.Exponential('mu', 5, shape=3)
    theta_like = pm.Poisson(
        "theta_like",
        mu=mu,
        observed=X,
    )

Interestingly, this does not occur for some other likelihoods (e.g. normal).
I discovered this when the Binomial model appeared not to be learning when sampling with data.
Versions and main components
- PyMC/PyMC3 Version: 4.1.2
- Aesara Version: 2.7.5
- Python Version: 3.8.9
- Operating system: Ubuntu
- How did you install PyMC/PyMC3: pip
The graphviz is built from dependencies in the generative aesara graph, not in the logp one. X only shows as an input in the generative graph when it is used to define the shape of the likelihood RV. When the parameters specify the same number of dims as observed, the latter isn't used for determining the shape and the arrow doesn't show up.
We should probably refactor the graphviz logic from scratch instead of keep patching it due to old assumptions from V3, over which it was built.
I think it would make more sense to show the Bayesian generative model, where X would make more sense as an output of the likelihood RV.
If we want to plot the logp graph instead, then it would make sense as an input.
By the way, this is also indicative of a bug in the variable creation logic, as observed may have broadcasted shapes beyond the parameters (e.g. if mu.shape=(1,)), and PyMC would not have taken this into consideration.
This is related to #5993, although that one shows the bug in relation to dims, and this one is in relation to observed.
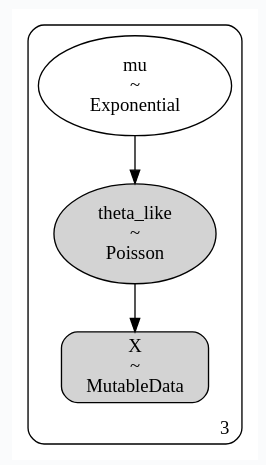
This was fixed by #6011, it was due to casting of the MutableData. The two graphs now look like this: