language-tools
 language-tools copied to clipboard
Electron using 100% cpu with Prisma extension turned on
Issue Type: Bug
I am sharing a Primsa schema across multiple packages using symbolic links. I suspect the Prisma extension is having trouble with this setup.
Extension version: 3.12.0 VS Code version: Code 1.66.1 (8dfae7a5cd50421d10cd99cb873990460525a898, 2022-04-06T14:49:47.400Z) OS version: Darwin x64 21.2.0 Restricted Mode: No
System Info
| Item | Value |
|---|---|
| CPUs | Intel(R) Core(TM) i9-9880H CPU @ 2.30GHz (16 x 2300) |
| GPU Status | 2d_canvas: enabled canvas_oop_rasterization: disabled_off direct_rendering_display_compositor: disabled_off_ok gpu_compositing: enabled metal: disabled_off multiple_raster_threads: enabled_on oop_rasterization: enabled opengl: enabled_on rasterization: enabled raw_draw: disabled_off_ok skia_renderer: enabled_on video_decode: enabled video_encode: enabled webgl: enabled webgl2: enabled |
| Load (avg) | 2, 3, 4 |
| Memory (System) | 32.00GB (0.59GB free) |
| Process Argv | --crash-reporter-id 9b1dda95-bb03-4b84-aa39-6cf6657594ae |
| Screen Reader | no |
| VM | 0% |
A/B Experiments
vsliv368cf:30146710
vsreu685:30147344
python383:30185418
vspor879:30202332
vspor708:30202333
vspor363:30204092
pythonvspyl392:30443607
pythontb:30283811
pythonvspyt551cf:30345471
pythonptprofiler:30281270
vsdfh931cf:30280410
vshan820:30294714
vstes263:30335439
vscorecescf:30445987
pythondataviewer:30285071
vscod805:30301674
pythonvspyt200:30340761
binariesv615:30325510
bridge0708:30335490
bridge0723:30353136
vsaa593cf:30376535
vsc1dst:30438360
pythonvs932:30410667
wslgetstarted:30449410
pythonvsnew555:30457759
vscscmwlcmt:30465135
pynewfile477:30463512
Can you help us set up a minimal reproduction of your setup, optimally as a Github repo we can just clone and test it out ourselves? Thanks.
@dmcd Could you try to disable the "File Watcher functionality"?

- Run the
Prisma: Disable the File Watcher functionality for Prisma Clientcommand - Did that solve the problem?
- If no, try to reload VS Code.
- If yes, please let us know, it will be helpful for us!
Great to hear that it solves your issue!
We want to work on the source of the file watcher issue, we'll update you when we have news, so you could try enabling it again then 👍🏼
Just to mention I had the same issue, but just using prisma in one repo. Disabling the file watcher solved it for me also.
(version 4.1)
Hi! @dmcd @jwld
I created a PR to fix the file watcher issue, I'm happy to report that on my computer (macOS m1) it's now fixed. (CPU goes from ~100% previously to 0%)
Could you confirm it's also fixed for you as well?
Follow these instructions
First, confirm that the CPU usage is high using the Prisma extension from the VS Code marketplace
- Open your project using Prisma
- If you disabled the Prisma File Watcher functionality, enable it again from the command palette:

- Open the
schema.prismafile from your project - Use "Open Process Explorer" from VS Code' menu or open the OS Activity monitor

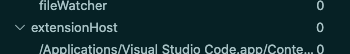
- Note / screenshot the CPU usage for the extension host above the Prisma extension process for the explorer or for the Activity Monitor, the
Code Helper (Renderer)value and share it at the end
Second, confirm that with the new extension the CPU usage is low using a special build from my PR
Note: only the file watcher logic was changed.
- Uninstall any Prisma extension installed (uninstall is preferred as only disabling might interfere in some ways)
- Download https://github.com/prisma/language-tools/blob/artifacts/pull-request-artifacts/pr1243-prisma.vsix?raw=true
- Click "Install from VSIX" from this button (screenshot) or command palette and select the
pr1243-prisma.vsixfile
- Restart the VS Code application
- Open the
schema.prismafile from your project - Use "Open Process Explorer" from VS Code' menu or open the OS Activity monitor
- Note / screenshot the CPU usage for the extension host above the Prisma extension process for the explorer or for the Activity Monitor, the
Code Helper (Renderer)value and share it at the end
Third, if you have a TypeScript project, confirm that the file watcher works and that the types are refreshed
- Open a TypeScript file from your project where you have Prisma Client queries like
await prisma.user.findMany() - Open the
schema.prismafile from your project - Both should have no errors
- Edit the
schema.prismafile and delete all the models (only keep thedatasource&generatorblocks) - Run
npx prisma generate - In your TypeScript file, you should now instantly see a Type Error that should look like the following

- Undo the changes in your
schema.prisma - Run
npx prisma generate - The Type Error(s) in the TypeScript file should be gone now
Please share something like the following: I tested on ... (macOS m1, Windows, Linux....)
- Current extension: screenshot showing ~91% CPU (Note: CPU is only reported on the aggregated top line for some reason)

- Using
pr1243-prisma.vsix, screenshot after showing ~0% CPU usage 🎊
- The typings were updated successfully after
npx prisma generate, a Type Error was visible ✅
Thank you in advance 💚 Note: I'm waiting for some feedback before we switch to this new low CPU file watcher in a stable release on VS Code marketplace.
Thanks! Tested on macOS Catalina 10.15.7
Current extension:

Updated extension:
We don't use TS so can't confirm the third part.
Thanks for the feedback 💚
The fix is now in the latest 4.4.0 version on the marketplace https://marketplace.visualstudio.com/items?itemName=Prisma.prisma 🎊
For those who disabled the File Watcher functionality, you can enable it again.