graphql-framework-experiment
 graphql-framework-experiment copied to clipboard
Published
20 hours ago •
 prisma-labs
Debugging is broken ~ stop line does not match breakpoint
Nexus Report
{
  "node": "v12.18.2",
  "os": {
    "platform": "win32",
    "release": "10.0.18363"
  },
  "nexus": "0.26.0-next.9",
  "plugins": [
    "nexus-plugin-prisma"
  ],
  "otherDependencies": {
    "bcryptjs": "2.4.3",
    "cors": "^2.8.5",
    "dotenv": "^8.2.0",
    "firebase-admin": "^9.0.0",
    "got": "^11.5.0",
    "jsonwebtoken": "8.5.1",
    "metascraper": "^5.12.17",
    "metascraper-description": "^5.12.17",
    "metascraper-image": "^5.12.17",
    "metascraper-logo-favicon": "^5.12.18",
    "metascraper-title": "^5.12.17",
    "metascraper-url": "^5.12.17",
    "nexus-plugin-shield": "0.2.0",
    "zod": "^1.9.2"
  },
  "devDependencies": {
    "@types/bcryptjs": "2.4.2",
    "@types/cors": "^2.8.6",
    "@types/jsonwebtoken": "8.5.0",
    "prettier": "2.0.5",
    "typescript": "^3.9.7"
  },
  "hasAppModule": true,
  "packageManager": "yarn",
  "errorsWhileGatheringReport": {
    "gettingLayout": null,
    "gettingPluginManifests": null
  }
}
Screenshot
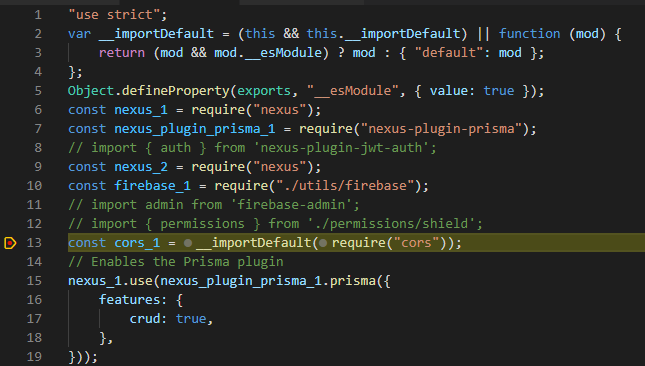
Description
The debugger should not be stopping in what appears to be a transpiled file. In the actual file (non-transpiled), I set the breakpoint to the use() line below. In webstorm, the line that the debugger stops on is different from the line that I put the breakpoint on.
Repro
Simply set a breakpoint and debug. You can easily repro this in the plugins-prisma-and-jwt-auth-and-shield project from the example repo.
This might be a windows specific issue. With a quick webstorm test, it seems to work better on mac.
This is due to missing source maps (js.map) fill as transpiring set to noEmit. Even setting inlinesourcemaps downs work