OPNsense v22.1 RFC 5424
Describe the bug OPNsesne v22.1 added RFC 5424 support
Screenshots
Firewall System (please complete the following information):
- OPNsense
- Version 22.1
Operating System (please complete the following information):
- Docker Installation
Elasticsearch, Logstash, Kibana (please complete the following information):
-
7.16.3
-
[ ] Add GROK support for OPNsense RFC 5424
-
[x] Parses RFC 5424 logs ignoring the meta sequenceID integer
- Ignore or add to GROK
New GROK which adds the field event.sequence when RFC 5424 is ticked (OPNsense only)
<%{POSINT:[log][syslog][priority]}>?(%{INT:[log][syslog][version]}\s*)?(%{SYSLOGTIMESTAMP:[event][created]}|%{TIMESTAMP_ISO8601:[event][created]})\s(%{SYSLOGHOST:[host][name]}\s+)?(%{PROG:[process][name]}\:|%{PROG:[process][name]})(\s*)?(\[)?(%{POSINT:[process][pid]}(\]:)?)?\s*(\-\s*\-)?(-\s*)?\s*(\[meta sequenceId=\"%{INT:[event]sequence]}\"\]\s)?*%{GREEDYDATA:filter_message}
Works but breaks pfSense Logs
Hi, I am using the new version of opnsense, and i get stuck that there are no firewall-logs in kibana. Already tried to setup pfelk few times but it didn't work. Could you explain that? I didn't check the RF 5424 box as descriped in the wiki. Months before ive got pfelk running with this setup, but now it didn't work. And I didn't receive a Firewall-Dashboard at installation, is that korrekt?
Thanks!
What method did you install it with?
Can you provide and output from the error-data script (/etc/pfelk/scripts/error-data.sh)
Hi, I try to use the script installer and the manual method, both with the same ending scenario. Here the output from error-data script error.pfelk.log
Based on the log file, everything appears to be running. Let's try the following:
Cleanup the /etc/pfelk/conf.d/ to only the following files:
- 01-inputs.pfelk
- 05-apps.pfelk
- 30-geoip.pfelk
- 49-cleanup.pfelk
- 50-outputs.pfelk
Next, restart logstash (systemctl restart logstash.service). Give it a few and let me know if that works. If not we'll check on some additional items (logstash roles/permissions).
Done, but still nothing from pfelk-firewall... nginx, dhcp, work, but i can't get anything from the firewall...
awe...so nginx, dhcp, are receiving logs. Typically, the logs would be captured with grok failures or Logstash errors but neither of those appear to be the cause here.
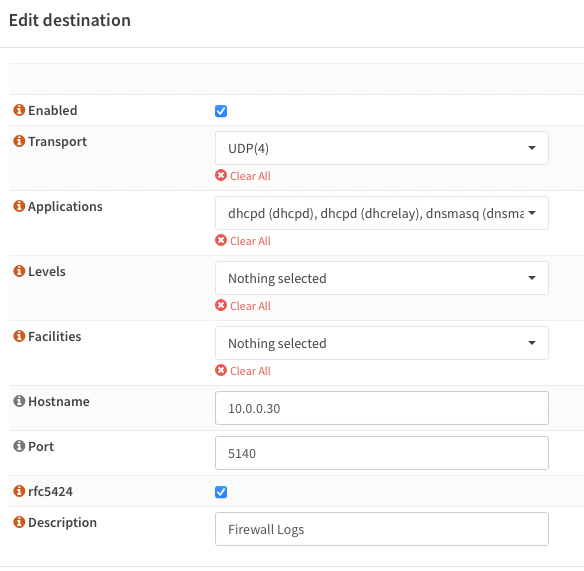
Check the following within opnsense:
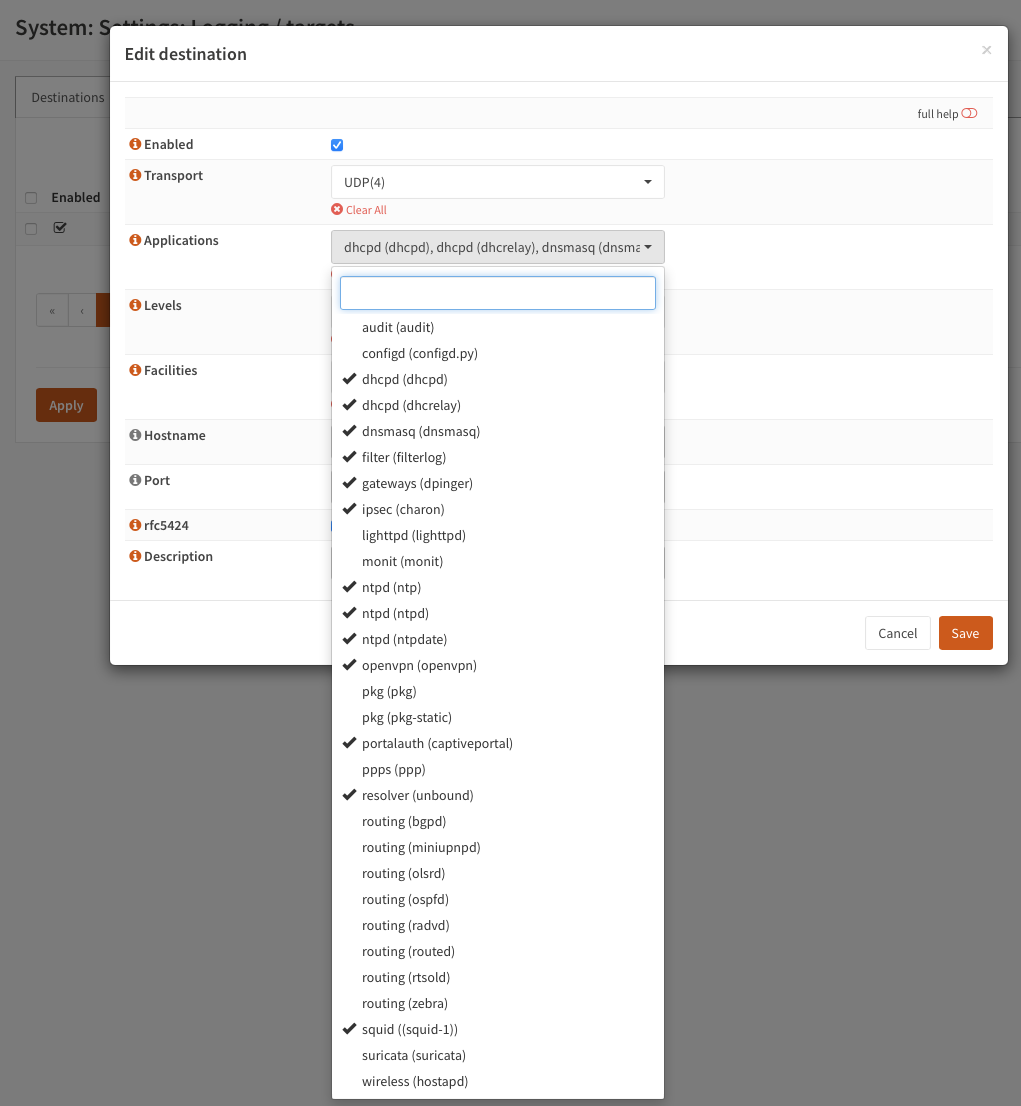
Which one's do you have ticked.
I tried both, without anything selected as shown in the wiki and with the use-cases i need. Nothing would change anything to give me a "Firewall-Log"
The "filter (filterlog) " is the item required to obtain firewall messages.
I've had issues with past OPNsense versions where I had to stop and restart syslog-ng or enable/disable remote logging.
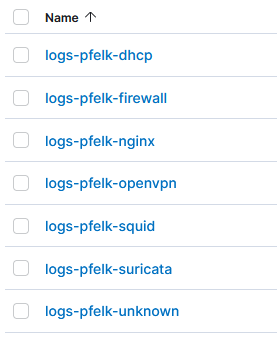
Next, login to Kibana and navigate to Stack Managment>>Index Management. What data streams are listed on your system.
Easy fix.... you'll need to manually import the missing saved objects:
https://github.com/pfelk/pfelk/blob/main/install/security.md#three-dashboards
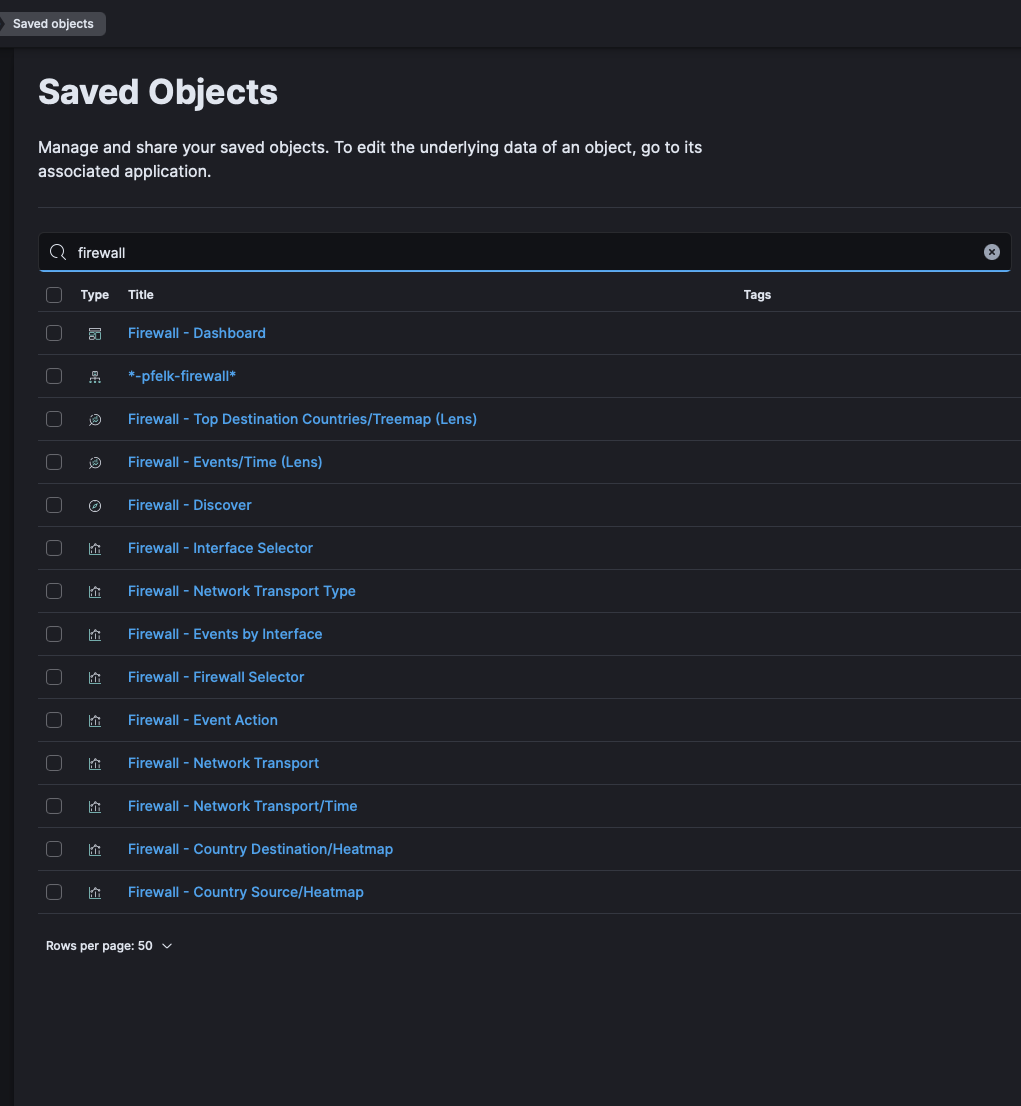
found it, typo in the link for the firewall-dashboard https://raw.githubusercontent.com/pfelk/pfelk/main/etc/pfelk/dashboard/22.01-firewall.ndjson
Try the attached...if that works, I'll update the repo.
Be sure to remove the trailing .txt
Where are you pulling that link? The listed here: https://github.com/pfelk/pfelk/blob/main/install/security.md is correct (step 3a)
I corrected the script, looks the download path was wrong, but the install path looks correct.
https://raw.githubusercontent.com/pfelk/pfelk/main/etc/pfelk/dashboard/22.04-firewall.ndjson
https://github.com/pfelk/pfelk/blob/main/etc/pfelk/scripts/pfelk-kibana-saved-objects.sh the script i used
No way, thanks for your help! Just a short question, there are any dashboards for vpn planned?
what type of logs? OpenVPN is on the list but those logs are a bit messy but any help is appreciated.
Thanks for your answer depenting on openvpn. Another question, is there still anything wrong with suricata and captive-dashboard? I didn't get any usefull inormation there.