heatmap.js
 heatmap.js copied to clipboard
Published
20 hours ago •
 pa7
pa7
Areas with wrong value
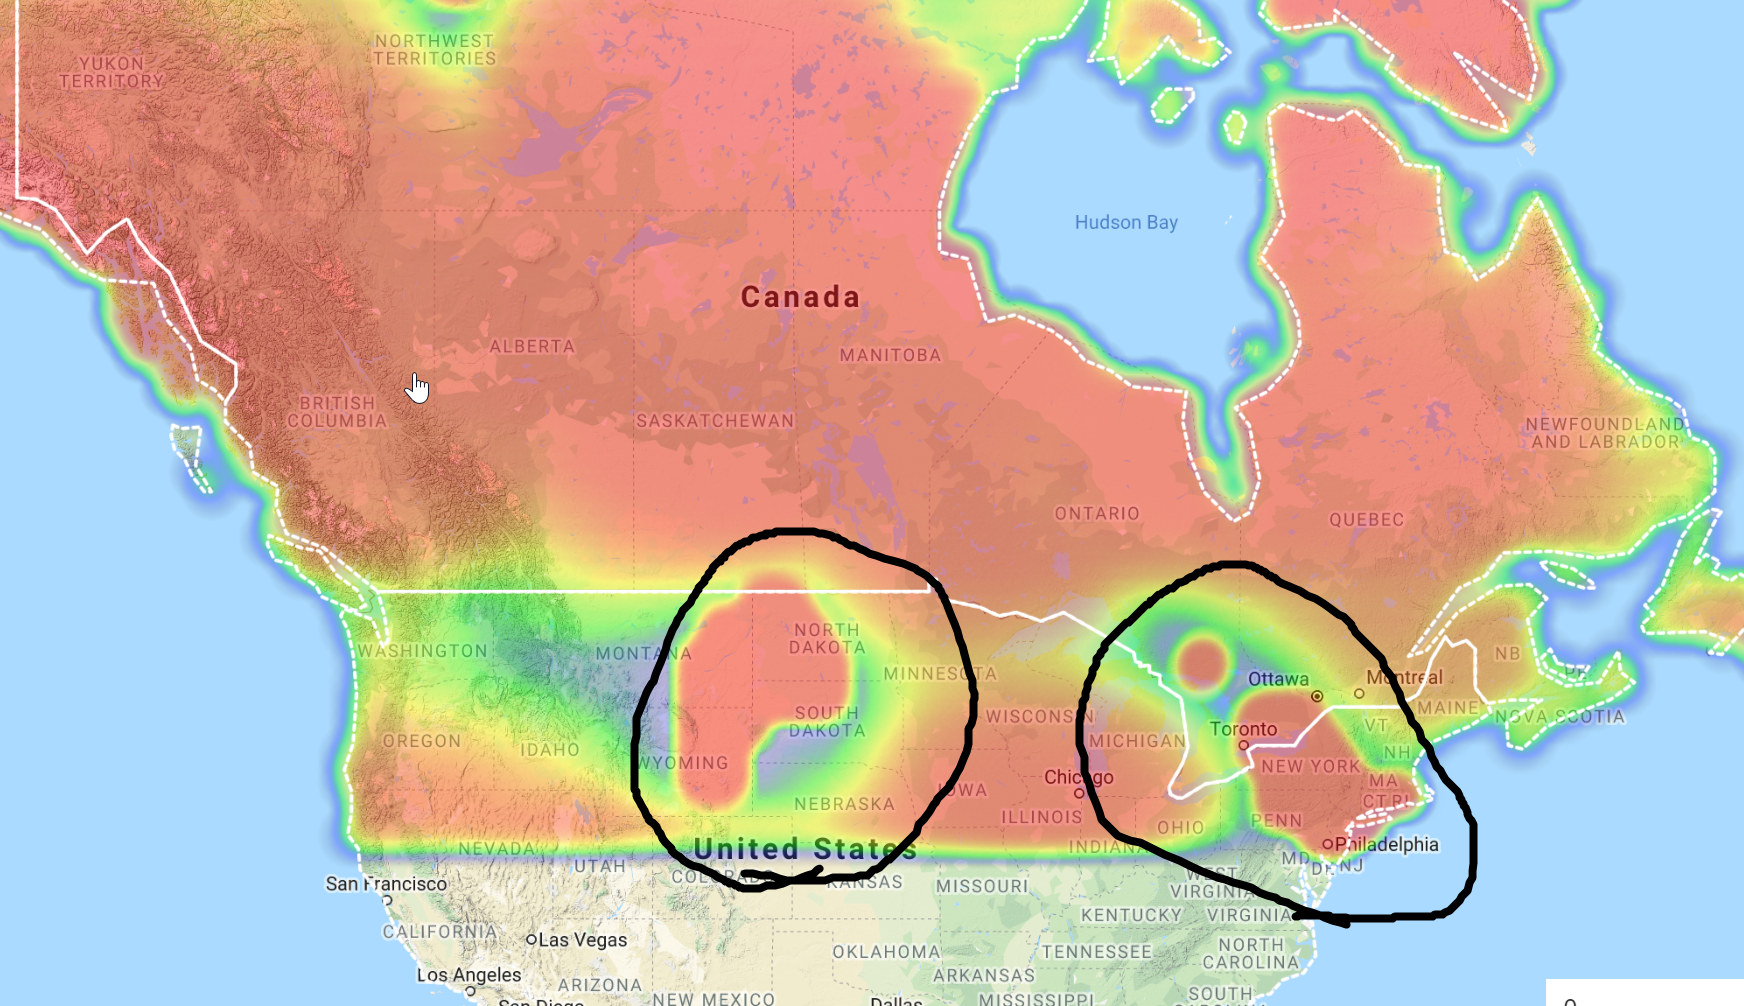 I'm using this heatmap to show values between 0 -1, but in the photo shown above, the areas where I marked, even though the value is zero(minimum value ), but it shows those areas as areas with high value.
hey @ehsan99999 , how does the data that you're passing in look like? Are the values integers that represent the data range you'd like to visualize?