truffleruby
 truffleruby copied to clipboard
Native memory leak even after closing Context / Engine
Environment
graalvm-ce-java11-linux-amd64-22.3.1.tar.gz, Fedora 36, 6.1.18-100.fc36.x86_64
Also occurs with the ol9-java11-22.3.1 container.
gu install ruby
gem install app-info -v 2.8.3
Problem
I am using a gem called app-info to parse mobile application packages. It in turn depends on, among others, REXML via CFPropertyList, protobuf, and rubyzip to unzip said packages.
AppInfoJavaGraalvmMemoryLeakReprodApplication.java#L75-L92
    void testParseLargeIPAThreeAttributes() throws InterruptedException {
        URL url = getClass().getClassLoader().getResource("apps/YouTube_17.43.1_1668160730.ipa");
        try (Context ctx = Context.newBuilder().allowAllAccess(true).build()) {
            ctx.eval("ruby", "require 'app-info'");
            Value appInfoGem = ctx.eval("ruby", "AppInfo");
            Value ipaObject = appInfoGem.getMember("parse").execute(url.getPath());
            String name = ipaObject.getMember("name").execute().asString(); // "YouTube"
            String version = ipaObject.getMember("build_version").execute().asString(); // "17.43.1"
            String team_name = ipaObject.getMember("team_name").execute().asString();
            List<String> devices = ipaObject.getMember("devices").execute().as(List.class);
            ipaObject.getMember("clear!").executeVoid();
            ctx.eval("ruby", "GC.start");
            System.out.printf("parse completed %s %s%n", name, version);
        }
        System.gc();
        System.runFinalization();
        Thread.sleep(2000);
    }
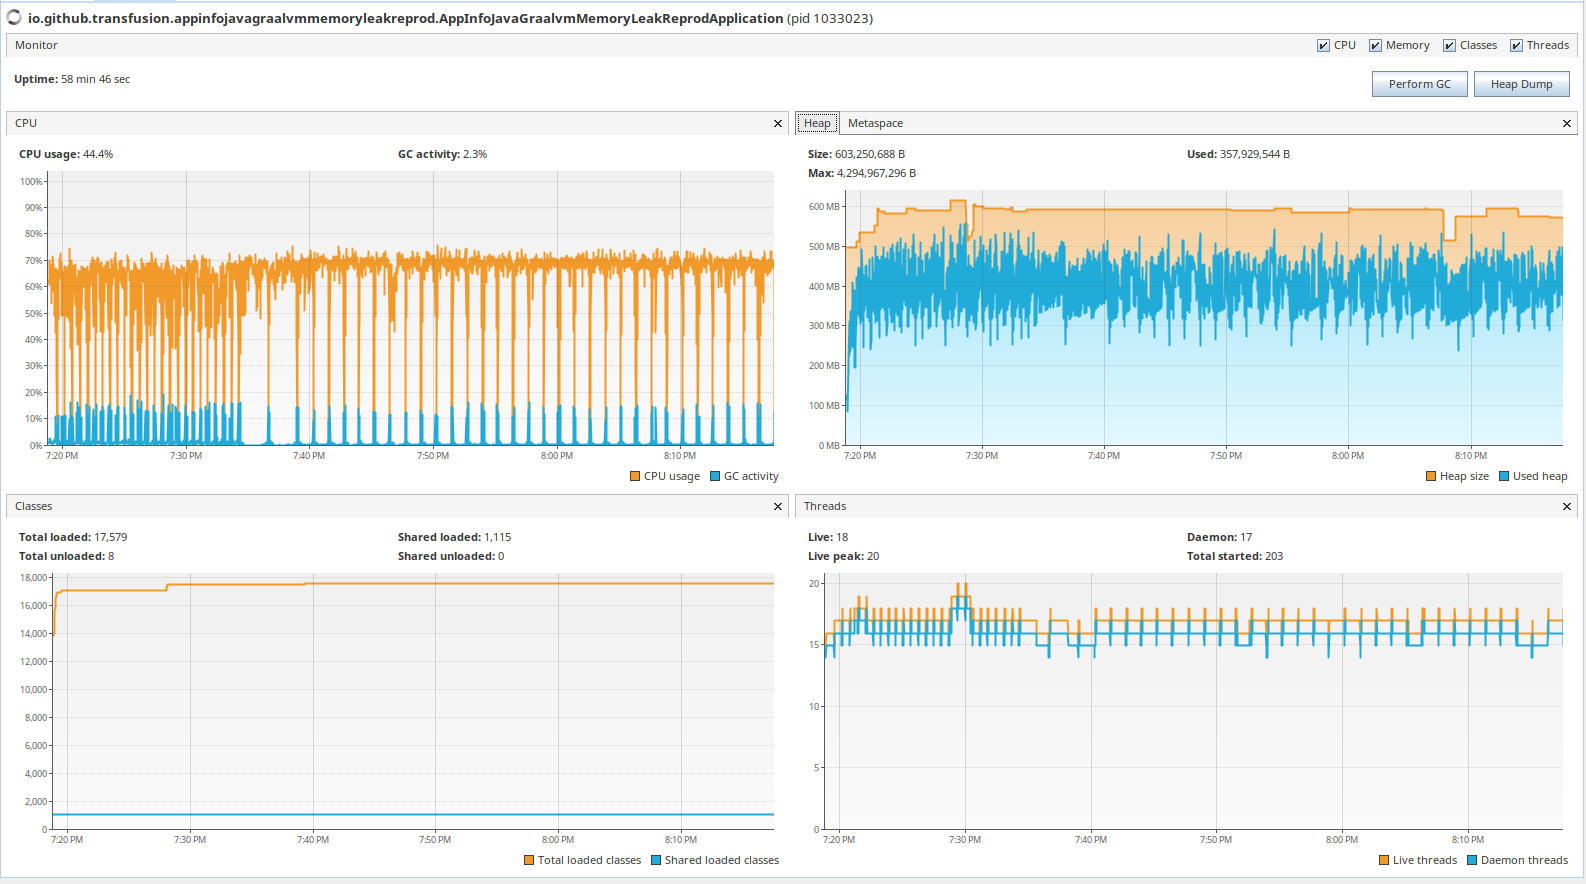
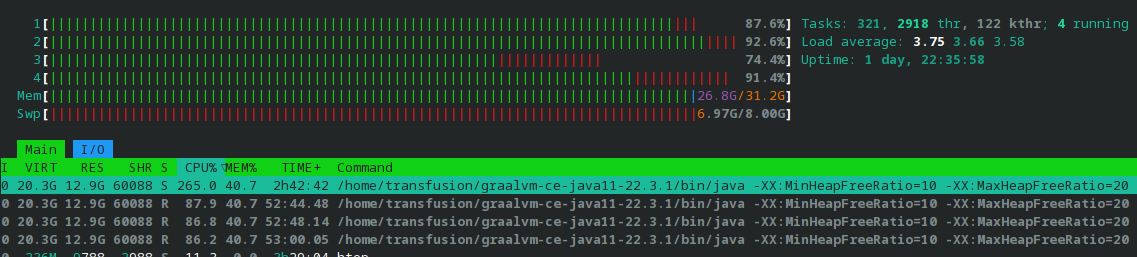
When I run this method in a loop, both my RES and VIRT in htop increase uncontrollably, despite JVM-managed memory remaining perfectly constant even after an hour.
./jcmd 1381241 VM.native_memory detail.diff after 34 iterations
The main offender appears to be repeated calls to Unsafe#allocateMemory.
Total: reserved=10142938KB +4418712KB, committed=5342990KB +4576824KB
...
-                     Other (reserved=4450976KB +4365490KB, committed=4450976KB +4365490KB)
                            (malloc=4450976KB +4365490KB #363825 +363456)

...

[0x00007f2078a6f0ac] Unsafe_AllocateMemory0+0xdc
[0x00007f20593743fb]
                             (malloc=4450973KB type=Other +4365506KB #363753 +363457)
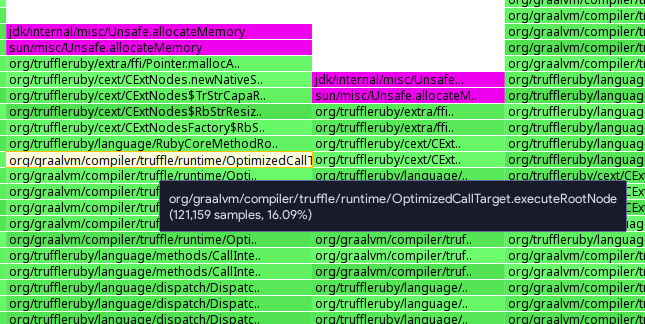
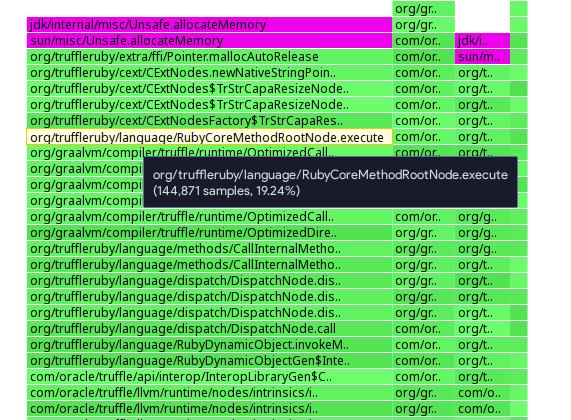
Here are two flame graphs I created with async-profiler to figure out what was calling Unsafe#allocateMemory.
- In my live environment (I run this as part of a Spring Boot web application)
- Random 10 minute sample of this minimal reproduction
- The rate of memory increase appears to decrease if fewer members are accessed or functions called on
Value ipaObject, however it is still never freed. - I also tried initializing an Engine outside the loop and reusing it with
Context.newBuilder().engine(engine)..., nothing improved. - I tried
jemallocout of curiosity, nothing improved. The profiler still showed 96.1% of heap allocations being attributable toUnsafe_AllocateMemory0.
Reproduction
Download graalvm-ce-java11-linux-amd64-22.3.1.tar.gz, then
gu install ruby
gem install app-info -v 2.8.3
Please clone https://github.com/Transfusion/app-info-java-graalvm-memory-leak-reprod.git, then in the newly cloned directory, run
# The sample .ipa file is split because of GH's 100 MB file size limit
cat src/main/resources/apps/YouTube_17.43.1_1668160730.ipa.segment* > src/main/resources/apps/YouTube_17.43.1_1668160730.ipa

JAVA_HOME=~/graalvm-ce-java11-22.3.1/ ./gradlew -PjvmArgs="-XX:MinHeapFreeRatio=10 -XX:MaxHeapFreeRatio=20  -agentlib:jdwp=transport=dt_socket,server=y,suspend=n,address=*:5011 -XX:+UseSerialGC -Xmx4096m -XX:NativeMemoryTracking=detail" bootRun
Thank you for the great issue report.
So these allocations are from C extensions and for native pointers, as used by the gems. A Cleaner thread should take care of releasing them when they are no longer needed, could you check if that is running for you, e.g. via dumping stacktraces with SIGQUIT or in VisualVM?
There was a known issue (fixed on master) with the Cleaner in --native mode, but you are running in --jvm mode, so it doesn't apply (Fix memory leak in --native mode for native extension handles and native pointers (@eregon). in the changelog).
There was also another issue that handles for C extensions could stay alive longer than expected, this has also been fixed on master (Fix a resource leak from allocators defined in C extensions (@aardvark179). and Marking of native structures wrapped in objects is now done on C call exit to reduce memory overhead (@aardvark179). in the changelog).
So I think the first step would be to try with a dev build from https://github.com/graalvm/graalvm-ce-dev-builds/