jdk
 jdk copied to clipboard
8290025: Remove the Sweeper
When the world was still young, the sweeper was built to unload bad smelling nmethods. While it has been going through various revisions, the GCs got support for class unloading, and the need for the GCs to get rid of nmethods with a different unpleasant scent.
The two systems would now compete for unloading nmethods, and the responsibility of throwing away nmethods would blur. The sweeper was still good at throwing away nmethods faster as it only needs to scan stacks, and not do a full GC.
With the advent of Loom, the situation has gotten even worse. The stacks are now also in the Java heap. The sweeper is unable to throw away nmethods without the liveness analysis of a full GC, which also performs code cache unloading, but isn't allowed to actually delete nmethods due to races with the sweeper. In a way we have the worst of both worlds, where both the sweeper and GC are crippled, unable to unload nmethods without the help of the other. And there are a very large number of complicated races that the JVM needs to deal with, especially with concurrent code cache unloading not interfering with concurrent sweeping. And concurrent sweeping not interfering with the application.
The sweeper cycle exposes 2 flavours of nmethods that are "dead" to the system. So whenever nmethods are used, we have to know they are not dead. But we typically don't have the tools to really know they are not dead. For example, one might think grabbing the CodeCache_lock and using an iterator that only walks is_alive() nmethods would help make sure you don't get dead nmethods in your iterator. However, that is not the case, because the CodeCache_lock can't be held across the entire zombie transition due to "reasons" that are not trivial to actually change. Because of this, code has to deal with nmethods flipping around randomly to a dead state.
I propose to get out of this sad situation, by removing the sweeper. If we need a full GC anyway to remove nmethods, we might as well let the GC do everything. This removes the notion of is_zombie(), is_unloaded() and hence is_alive() from the JVM. It also removes the notion of the orthogonal but related nmethodLocker to keep nmethods around, without preventing them from dying. We instead throw away nmethods the way we throw away pretty much anything else in the unloading GC code:
- Unlink
- Global sync
- Throw away
- Profit! This way, if you get a reference to an nmethod, it won't go away until the next safepoint poll, and will not flip around liveness due to concurrent transitions.
In the new model, we use nmethod entry barriers to keep track of the last time an nmethod was on-stack. This is then used to 1) prove that not_entrant nmethods that haven't been on-stack for an entire GC can be removed, and 2) heuristically remove nmethods that have never been called for N full GCs, where N is calculated based on code cache allocation rate, GC frequency, remaining free memory until "trouble", etc. Similar to metaspace, there is also some threshold GC trigger to start GC when the code cache is filling up, and nothing else is triggering full GCs. The threshold gets smaller as we approach a point of being uncomfortably close to code cache exhaustion. Past said point, we GC very aggressively, and you probably want a larger code cache.
I have tested this in mach5 tier1-7, I have run through perf aurora with no regressions, and also run an "internal large application" to see how it scales, also with no regressions. Since testing tier1-7 a few small tweaks have been made so I am running some extra testing.
I have tried to be as compatible as possible to previous sweeping related JVM flags, arguing that nothing in the flags implies whether the implementation is using a GC or a separate sweeper thread. However, the UseCodeAging flag I have obsoleted, as UseCodeCacheFlushing is the flag for deciding cold nmethods should be removed, and with the new mechanism for doing that, there is no need for UseCodeAging flag as well.
Progress
- [x] Change must be properly reviewed (1 review required, with at least 1 Reviewer)
- [x] Change must not contain extraneous whitespace
- [x] Commit message must refer to an issue
Issue
- JDK-8290025: Remove the Sweeper
Reviewers
- Stefan Karlsson (@stefank - Reviewer) ⚠️ Review applies to 5ca520f7
- Vladimir Kozlov (@vnkozlov - Reviewer) ⚠️ Review applies to 331ad2f7
- Igor Veresov (@veresov - Reviewer) ⚠️ Review applies to 29545778
- Coleen Phillimore (@coleenp - Reviewer) ⚠️ Review applies to 29545778
- Vladimir Ivanov (@iwanowww - Reviewer) ⚠️ Review applies to 3cd50998
Reviewing
Using git
Checkout this PR locally:
$ git fetch https://git.openjdk.org/jdk pull/9741/head:pull/9741
$ git checkout pull/9741
Update a local copy of the PR:
$ git checkout pull/9741
$ git pull https://git.openjdk.org/jdk pull/9741/head
Using Skara CLI tools
Checkout this PR locally:
$ git pr checkout 9741
View PR using the GUI difftool:
$ git pr show -t 9741
Using diff file
Download this PR as a diff file:
https://git.openjdk.org/jdk/pull/9741.diff
:wave: Welcome back eosterlund! A progress list of the required criteria for merging this PR into master will be added to the body of your pull request. There are additional pull request commands available for use with this pull request.
Webrevs
- 12: Full - Incremental (93f29a69)
- 11: Full (21d4ccb5)
- 10: Full (a06919b1)
- 09: Full - Incremental (8c011d7c)
- 08: Full - Incremental (fdb26648)
- 07: Full - Incremental (3cd50998)
- 06: Full - Incremental (07470c52)
- 05: Full (29545778)
- 04: Full - Incremental (814fdd4b)
- 03: Full - Incremental (691093d0)
- 02: Full - Incremental (331ad2f7)
- 01: Full - Incremental (4d11d460)
- 00: Full (5ca520f7)
@fisk This change now passes all automated pre-integration checks.
ℹ️ This project also has non-automated pre-integration requirements. Please see the file CONTRIBUTING.md for details.
After integration, the commit message for the final commit will be:
8290025: Remove the Sweeper

Reviewed-by: stefank, kvn, iveresov, coleenp, vlivanov, mdoerr
You can use pull request commands such as /summary, /contributor and /issue to adjust it as needed.
At the time when this comment was updated there had been 14 new commits pushed to the master branch:
- 5a20bc44b1fb4edb6ab714191cdc6c3f33ac9836: 8292715: Cleanup Problemlist
- 7b81a9c75d60f6eb2727515bacfffcf7cf15e128: 8289764: gc/lock tests failed with "OutOfMemoryError: Java heap space: failed reallocation of scalar replaced objects"
- 76ee5495cd00f5546a5748051cc36965a8e936db: 8292329: Enable CDS shared heap for zero builds
- 14623c6087105a4228ff190e9e27372729b2bc4b: 8292739: Invalid legacy entries may be returned by Provider.getServices() call
- 568be58e8521e5e87baca1872ba8cc1941607bb7: 8290469: Add new positioning options to PassFailJFrame test framework
- 69448f9c1a9b123be8ef63bb039111a8976a8da6: 8292679: Simplify thread creation in gtest and port 2 tests to new way
- 3c2289d65157fca3f303d2fe703b31ef53b2f5bf: 8215916: The failure reason of an optional JAAS LoginModule is not logged
- 71ab5c95af28497fb31aba8ba9597da71bc4d3d5: 8292816: GPL Classpath exception missing from assemblyprefix.h
- c0623972cffdbcd7f80e84a1ec344fd382a4a5cc: 8292713: Unsafe.allocateInstance should be intrinsified without UseUnalignedAccesses
- a45a4b9465d7d01715425000c4fd47c0aa3e76ca: 8292194: G1 nmethod entry barrier disarm value wraps around too early
- ... and 4 more: https://git.openjdk.org/jdk/compare/ad2e0c4df045261c04b00bfa1faf5c21392edc58...master
As there are no conflicts, your changes will automatically be rebased on top of these commits when integrating. If you prefer to avoid this automatic rebasing, please check the documentation for the /integrate command for further details.
➡️ To integrate this PR with the above commit message to the master branch, type /integrate in a new comment.
Hi @fisk, thanks for the amazing cleanup! We've had a bunch of issues with the code sweeper and AsyncGetCallTrace with trying to unwind from dead code blobs (or what looked like it at least). Have you run some stress tests for AsyncGetCallTrace and this change? It may be something we can look into to make sure it doesn't increase the chances of crashes, or even reduces the chances of crashes. CC @jbachorik @parttimenerd
Hi Erik,
The change breaks the ARM32 port as the nmethod entry barriers are not implemented there yet. We need a way to work without nmethod entry barriers for the ARM32 platform.
# To suppress the following error report, specify this argument
# after -XX: or in .hotspotrc:  SuppressErrorAt=/barrierSetNMethod_arm.cpp:38
#
# A fatal error has been detected by the Java Runtime Environment:
#
#  Internal Error (/home/boris/jdk-fisk/src/hotspot/cpu/arm/gc/shared/barrierSetNMethod_arm.cpp:38), pid=10206, tid=10207
#  Error: ShouldNotReachHere()
#
# JRE version: OpenJDK Runtime Environment (20.0) (fastdebug build 20-internal-adhoc.boris.jdk-fisk)
# Java VM: OpenJDK Server VM (fastdebug 20-internal-adhoc.boris.jdk-fisk, mixed mode, g1 gc, linux-arm)
# Problematic frame:
# V  [libjvm.so+0x2bd610]  BarrierSetNMethod::is_armed(nmethod*)+0x2c
Hi @fisk, thanks for the amazing cleanup! We've had a bunch of issues with the code sweeper and AsyncGetCallTrace with trying to unwind from dead code blobs (or what looked like it at least). Have you run some stress tests for AsyncGetCallTrace and this change? It may be something we can look into to make sure it doesn't increase the chances of crashes, or even reduces the chances of crashes. CC @jbachorik @parttimenerd
I would certainly appreciate your help in stress testing that.
Hi Erik,
The change breaks the ARM32 port as the nmethod entry barriers are not implemented there yet. We need a way to work without nmethod entry barriers for the ARM32 platform.
# To suppress the following error report, specify this argument

# after -XX: or in .hotspotrc:  SuppressErrorAt=/barrierSetNMethod_arm.cpp:38

#

# A fatal error has been detected by the Java Runtime Environment:

#

#  Internal Error (/home/boris/jdk-fisk/src/hotspot/cpu/arm/gc/shared/barrierSetNMethod_arm.cpp:38), pid=10206, tid=10207

#  Error: ShouldNotReachHere()

#

# JRE version: OpenJDK Runtime Environment (20.0) (fastdebug build 20-internal-adhoc.boris.jdk-fisk)

# Java VM: OpenJDK Server VM (fastdebug 20-internal-adhoc.boris.jdk-fisk, mixed mode, g1 gc, linux-arm)

# Problematic frame:

# V  [libjvm.so+0x2bd610]  BarrierSetNMethod::is_armed(nmethod*)+0x2c
Is there a plan for the arm32 port to support nmethod entry barriers? I would really appreciate if the solution to this problem is that arm32 implements nmethod entry barriers. You only need to support the STW data and code patching variation, and it should do pretty much exactly what said AArch64 port does. Arm32 is the only platform I know of that doesn't support nmethod entry barriers, and IMO the JVM should be able to assume this is a feature that we can rely on.
Erik,
A time ago (not the current code base under review) I noticed that your code sweeper algorithm is more aggressive. Capturing data from output of the -XX:+PrintMethodFlushing option (since the option does not exist in your code, I've added the printout of CodeCache::unallocated_capacity), I build a CodeCache capacity picture while the application run (jmh renaissance benchmark with -f 0 option). Before the changes, free space was steadily declining. With your change, cold methods were quickly cleaned up despite the fact that the cache is less than half full.
(I try to insert pictures here: before and after the change)

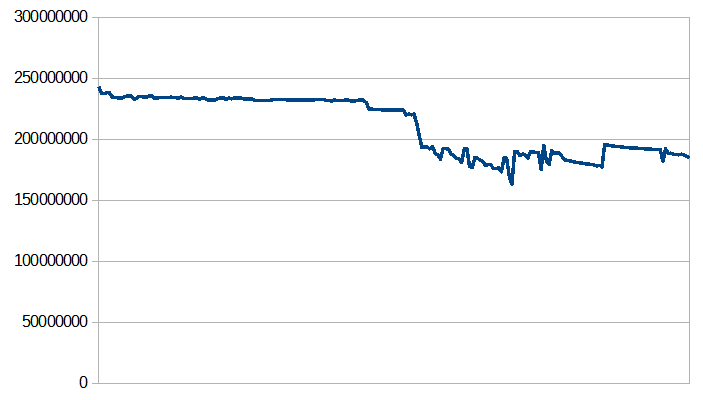
My concern is that there may be performance degradation in cases where the application periodically changes activity while running.
thanks, Boris
Erik,
A time ago (not the current code base under review) I noticed that your code sweeper algorithm is more aggressive.
Capturing data from output of the -XX:+PrintMethodFlushing option (since the option does not exist in your code,
I've added the printout of CodeCache::unallocated_capacity), I build a CodeCache capacity picture
while the application run (jmh renaissance benchmark with -f 0 option). Before the changes, free space was steadily declining.
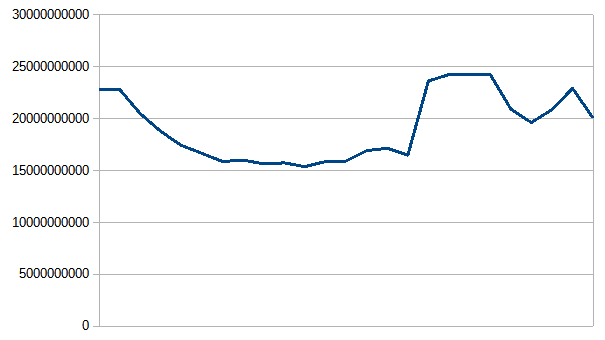
With your change, cold methods were quickly cleaned up despite the fact that the cache is less than half full.
(I try to insert pictures here: before and after the change)
My concern is that there may be performance degradation in cases where the application periodically changes activity while running.
thanks,
Boris
I would be interested in seeing what the graph looks like with my current proposed change. I don't know what state my prototype was in when you performed measurements, and the heuristics have been tweaked.
Having said that, if half the code cache was filled up, it sounds like it's getting to a point where you do want to flush things that haven't been used in a long while, to avoid getting into the "red zone" of aggressive sweeping at 90%, in order to free up space for currently hot code. To me it looks like it is working kind of as expected.
Was there a regression due to unloading perceivably cold code?
You can get more information about the heuristic decisions with -Xlog:codecache with my change.
@luhenry @fisk I'm going to stress test it with my jdk-profiling-tester on M1 and x86 over night (comparing it with the current master).
@luhenry @fisk I'm going to stress test it with my jdk-profiling-tester on M1 and x86 over night (comparing it with the current master).
Thank you!
There are still 15 comments that refer to zombie in the hotspot/share/** codebase. Would be nice to nuke them all to avoid stale, confusing and misleading information.
There is also some printing and non product flags which needs an overhaul in what terminology to use, and with what meaning, in the world where the sweeper and zombie nmethods are gone.
The second part is just an observation of future work, but it would be nice to have this patch at least deliver with no stale zombie comments.
Details
-
Comments
src/hotspot/share/code/codeCache.cpp:1290- Remove? Or just call when unloaded/unloading.
src/hotspot/share/code/compiledIC.cpp:370- Rephrase, confusing.
src/hotspot/share/code/compiledMethod.cpp:313- Rephrase, confusing.
src/hotspot/share/code/compiledMethod.cpp:511- Remove?
src/hotspot/share/code/compiledMethod.cpp:515- Remove? Confusing.
src/hotspot/share/code/compiledMethod.cpp:596- Remove zombie? Also what is unloaded nmethod in this context.
src/hotspot/share/code/dependencyContext.cpp:71- Rephrase, confusing.
src/hotspot/share/code/nmethod.cpp:1166- Remove?
src/hotspot/share/code/nmethod.cpp:1171- Remove? Confusing.
src/hotspot/share/code/nmethod.cpp:1184- Remove? Confusing.
src/hotspot/share/code/nmethod.cpp:1422- Rephrase, confusing. Many zombie interactions/assumptions in one comment.
src/hotspot/share/code/nmethod.hpp:268- Remove.
zombie,unloadedenums no longer exist
- Remove.
src/hotspot/share/compiler/compileTask.cpp:243- Rephrase or remove, confusing.
src/hotspot/share/oops/method.cpp:1168- Rephrase, confusing.
src/hotspot/share/prims/jvmtiImpl.cpp:1079- Rephrase, confusing. Also meaning of unloaded.
-
Not product flag
ZombieALotandZombieALotInterval- Needs an overhaul with respects to what terminology to use and what it is suppose to represent
-
Printing
src/hotspot/share/code/codeCache.cpp:1643src/hotspot/share/code/codeHeapState.cpp- Needs an overhaul with respects to what terminology to use and what it is suppose to represent
I would be interested in seeing what the graph looks like with my current proposed change. I don't know what state my prototype was in when you performed measurements, and the heuristics have been tweaked.
Below is a CodeCache chart (numbers from -Xlog:codecache this time) on the current proposed change. App gets 250MB of CodeCache, and executes 23 independent benchmarks.
Was there a regression due to unloading perceivably cold code?
No, specific of my run is a set of independent benchmarks: warmup, iteration, warmup, iteration - it does not get regression unless the CodeHeap is completely over. Sweeper itself does not affect performance, I checked it. My concern is about user applications.
Having said that, if half the code cache was filled up, it sounds like it's getting to a point where you do want to flush things that haven't been used in a long while, to avoid getting into the "red zone" of aggressive sweeping at 90%, in order to free up space for currently hot code. To me it looks like it is working kind of as expected.
In my picture, we can see that the methods are swept out when the CodeCache is 70% free. For me it is not expected. Even a super-cold method can come back. We should not flush it when we are far from memory starvation.
Is there a plan for the arm32 port to support nmethod entry barriers?
I created a JBS record for this task: JDK-8291302 I do not have time for this task now. If no one takes it, I hope to find time for this in the late autumn. For now, please, make a "short term solution where if nmethod aging is turned off, you can run without nmethod entry barriers".
thank you!
There are still 15 comments that refer to
zombiein thehotspot/share/**codebase. Would be nice to nuke them all to avoid stale, confusing and misleading information.There is also some printing and non product flags which needs an overhaul in what terminology to use, and with what meaning, in the world where the sweeper and zombie nmethods are gone.
The second part is just an observation of future work, but it would be nice to have this patch at least deliver with no stale zombie comments.
Details
I found all mentions of zombie I could find. Notably left ZombieALot as it has never created zombies, so the name was already wrong and misleading. It should arguably be called DeoptimizeALot or something... but that's obviously already taken. I'd prefer not to not discuss its naming in this PR as it was already wrong and there are enough things to consider as it is in here.
Is there a plan for the arm32 port to support nmethod entry barriers?
I created a JBS record for this task: JDK-8291302 I do not have time for this task now. If no one takes it, I hope to find time for this in the late autumn. For now, please, make a "short term solution where if nmethod aging is turned off, you can run without nmethod entry barriers".
thank you!
Okay. I put in a special ARM32 mode for you for now. It will work but it won't remove cold nmethods. I really hope we can remove the special mode soon and assume all platforms have nmethod entry barriers. I don't like having special modes.
I would be interested in seeing what the graph looks like with my current proposed change. I don't know what state my prototype was in when you performed measurements, and the heuristics have been tweaked.
Below is a CodeCache chart (numbers from -Xlog:codecache this time) on the current proposed change. App gets 250MB of CodeCache, and executes 23 independent benchmarks.
Was there a regression due to unloading perceivably cold code?
No, specific of my run is a set of independent benchmarks: warmup, iteration, warmup, iteration - it does not get regression unless the CodeHeap is completely over. Sweeper itself does not affect performance, I checked it. My concern is about user applications.
Having said that, if half the code cache was filled up, it sounds like it's getting to a point where you do want to flush things that haven't been used in a long while, to avoid getting into the "red zone" of aggressive sweeping at 90%, in order to free up space for currently hot code. To me it looks like it is working kind of as expected.
In my picture, we can see that the methods are swept out when the CodeCache is 70% free. For me it is not expected. Even a super-cold method can come back. We should not flush it when we are far from memory starvation.
- It isn't obvious based on the chart that my new strategy unloads more nmethods due to being cold, than we did before. The sweeper before would make nmethods not_entrant in one cycle, but might need 4 cycles to actually be able to delete them. That means that the previous approach had much more floating garbage in the code cache, but that doesn't necessarily imply that the number of nuked nmethods were smaller. The new approach is much more effective and can do all the things necessary to detect cold nmethods and unload them from the code cache, in a single cycle, which immediately brings down the code cache size. It still might be that my new algorithm is more aggressive, but the data does not conclude that.
- The UseCodeCacheFlushing flag is on by default. Its assumption is that you want to "Remove cold/old nmethods from the code cache". Based on what you are saying, it sounds more like we shouldn't do that at all for some applications where you want super cold nmethods to still be around. I guess this flag can be turned off then, if you have such an application. Note though that if the application for example idles, then there is no allocation rate in the code cache, and my new heuristics won't remove anything, because it is based on how long until the code cache becomes "too full", given the current allocation rate (which is likely 0 when idling), while the old heuristics have been reported to reap the entire code cache in such situations.
Initial review of few
code/files. Will do more later.I am not comfortable with name
unloadingfor this process because historically, for me, it is associated with class unloading and "unloading" corresponding nmethods.cleaningis more similar withsweeping. But it could be only me.
Thanks for reviewing this change! I'm using the term "code cache unloading", because that is what we have always called unloading of nmethods triggered by the GC. And now it is the GC that owns this completely, so code cache unloading is the way in which nmethods are freed. At least that was my reasoning. I'd like to split the "unloading" parts of the CodeCache to a separate file, but I decided it's better to do that in a separate patch, as this patch is large enough and I don't want to move around code as well in it. Hope this makes sense.
Initial review of few
code/files. Will do more later. I am not comfortable with nameunloadingfor this process because historically, for me, it is associated with class unloading and "unloading" corresponding nmethods.cleaningis more similar withsweeping. But it could be only me.Thanks for reviewing this change! I'm using the term "code cache unloading", because that is what we have always called unloading of nmethods triggered by the GC. And now it is the GC that owns this completely, so code cache unloading is the way in which nmethods are freed. At least that was my reasoning. I'd like to split the "unloading" parts of the CodeCache to a separate file, but I decided it's better to do that in a separate patch, as this patch is large enough and I don't want to move around code as well in it. Hope this makes sense.
Okay, I agree since it is GC operation now.
@luhenry @fisk I'm going to stress test it with my jdk-profiling-tester on M1 and x86 over night (comparing it with the current master).
My script is unable to find any crashes (in both JDK builds on both platforms) which is good for AsyncProfiler users but bad for the overall use of my tester. I'll have to investigate that.
Thank you for taking this for a spin. I'm glad it isn't crashing more.
There are a few comments that mention the sweeper as well.
src/hotspot/share/jvmci/jvmci.hpp:110CodeInstallResult::nmethod_reclaimedenum- This seems like it is dead code now, there does not look like there is any safepoint between the creation of the
nmethodand the call tomake_in_use()so it should return true always? Not looked to close at it. But regardless, feels like it should be at least noted that theJVMCIRuntime::register_methodfunction should be looked at by someone in the future.
- This seems like it is dead code now, there does not look like there is any safepoint between the creation of the
src/hotspot/share/gc/shared/space.cpp:147- Old code, maybe just the reference to the sweeper can be removed.
@fisk this pull request can not be integrated into master due to one or more merge conflicts. To resolve these merge conflicts and update this pull request you can run the following commands in the local repository for your personal fork:
git checkout 8290025_remove_sweeper
git fetch https://git.openjdk.org/jdk master
git merge FETCH_HEAD
# resolve conflicts and follow the instructions given by git merge
git commit -m "Merge master"
git push
There are a few comments that mention the sweeper as well.
src/hotspot/share/jvmci/jvmci.hpp:110
CodeInstallResult::nmethod_reclaimedenum
- This seems like it is dead code now, there does not look like there is any safepoint between the creation of the
nmethodand the call tomake_in_use()so it should return true always? Not looked to close at it. But regardless, feels like it should be at least noted that theJVMCIRuntime::register_methodfunction should be looked at by someone in the future.
I removed the comment. It isn't dead code, nmethods can still be made not_entrant before being installed. Just not by the sweeper.
src/hotspot/share/gc/shared/space.cpp:147
- Old code, maybe just the reference to the sweeper can be removed.
This is referring to the sweeping part of the mark and sweep algorithm. CMS (Concurrent Mark Sweep) did sweeping concurrently. It's a different thing. One might argue the comment should go, but not in this patch.
So in the new world do we always need a GC cycle to flush (as opposed to unload) an method?
It still might be that my new algorithm is more aggressive, but the data does not conclude that
I tweaked JMH code to run Warmup iterations for all benchmarks first (a single vm run mode), and than run the final Iterations for the benchmarks (renaissance suite in my case). The idea is to check if a new sweeper algorithm flush the hot methods before the final iteration and get a performance penalty. I played with a benchmark set, combining them into different groups, changing the number of Warmup iterations and VM options. With this approach I do not find evidence that the new algorithm is more aggressive than the previous one.