opentelemetry-lambda
 opentelemetry-lambda copied to clipboard
Logging from the lambda extension should have a config to disable it
Currently logging in the collector lambda extension is not configurable (using go's log.Println directly), which is drowning out most of our lambda logs. Easiest way to do IMO is simply read a env variable (e.g OTEL_LAMBDA_EXTENSION_LOG_QUIET) then skip all log lines that is not for printing out error. Or alternatively, be quiet by default, then read OTEL_LAMBDA_EXTENSION_LOG_VERBOSE to enable these logs.
https://github.com/open-telemetry/opentelemetry-lambda/blob/main/collector/main.go
For context, example of the lambda extension logs:
2022/03/30 07:06:21 [collector] Launching OpenTelemetry Lambda extension, version:  v0.1.0
--
2022/03/30 07:06:21 Using config file at path /var/task/collector.yaml
2022/03/30 07:06:21 Registered extension ID: "0bc52143-9d3f-493f-a186-ab4d5c3242ff"
2022/03/30 07:06:21 [collector] Register response: {
"functionName": "xxxxxxxxxxxxxxxxxxxxxxxxx",
"functionVersion": "$LATEST",
"handler": "api_handler.handler"
}
2022/03/30 07:06:21 [collector] Waiting for event...
[WARNING]	2022-03-30T07:06:23.078Z		Could not convert OTEL_INSTRUMENTATION_AWS_LAMBDA_FLUSH_TIMEOUT value  to int
START RequestId: 204a0995-9fca-4ce6-9486-a81ef62281d7 Version: $LATEST
EXTENSION	Name: collector	State: Ready	Events: [INVOKE,SHUTDOWN]
2022/03/30 07:06:28 [collector] Received event: {
"eventType": "INVOKE",
"deadlineMs": 1648624017646,
"requestId": "204a0995-9fca-4ce6-9486-a81ef62281d7",
"invokedFunctionArn": "arn:aws:lambda:ap-northeast-1:520076009725:function:xxxxxxxxxxxxxxxxx",
"tracing": {
"type": "X-Amzn-Trace-Id",
"value": "Root=1-6244016c-32b2a684443120b1408e9200;Parent=405e5cb7181a127b;Sampled=1"
}
}
2022/03/30 07:06:28 [collector] Waiting for event...
Hey @lephuongbg, thanks for posting this issue!
Is this something that you could configure using the Collector Config file? By default Lambda Layers built using this repository use the debug log level:
https://github.com/open-telemetry/opentelemetry-lambda/blob/0a83149fe2f23a7dab64df6108cfa35f18cc2ae5/collector/config.yaml#L7-L9
https://github.com/open-telemetry/opentelemetry-lambda/blob/0a83149fe2f23a7dab64df6108cfa35f18cc2ae5/collector/Makefile#L23-L27
If you were using the ADOT distribution of this repo, you might want to reference AWS document on changing Lambda Layer ADOT Collector configuration.
Let me know if that helps!
Hi @NathanielRN, the logs I mentioned in this issue is from the Collector Lambda Extension part, not the Collector itself. I can already disable the collector's logs with the config file.
You can see in the example logs that they are events from the Lambda Extensions API. Basically IMO we don't care about those non-error logs as long as the collector works.
Can https://github.com/open-telemetry/opentelemetry-lambda/pull/236 be merged?
We are facing same issue where lambda extension generates it internal log and spits into our application log and cluttering our cloudwatch making hard to see out logs. which we don't need. Better if we can control extension logging level.
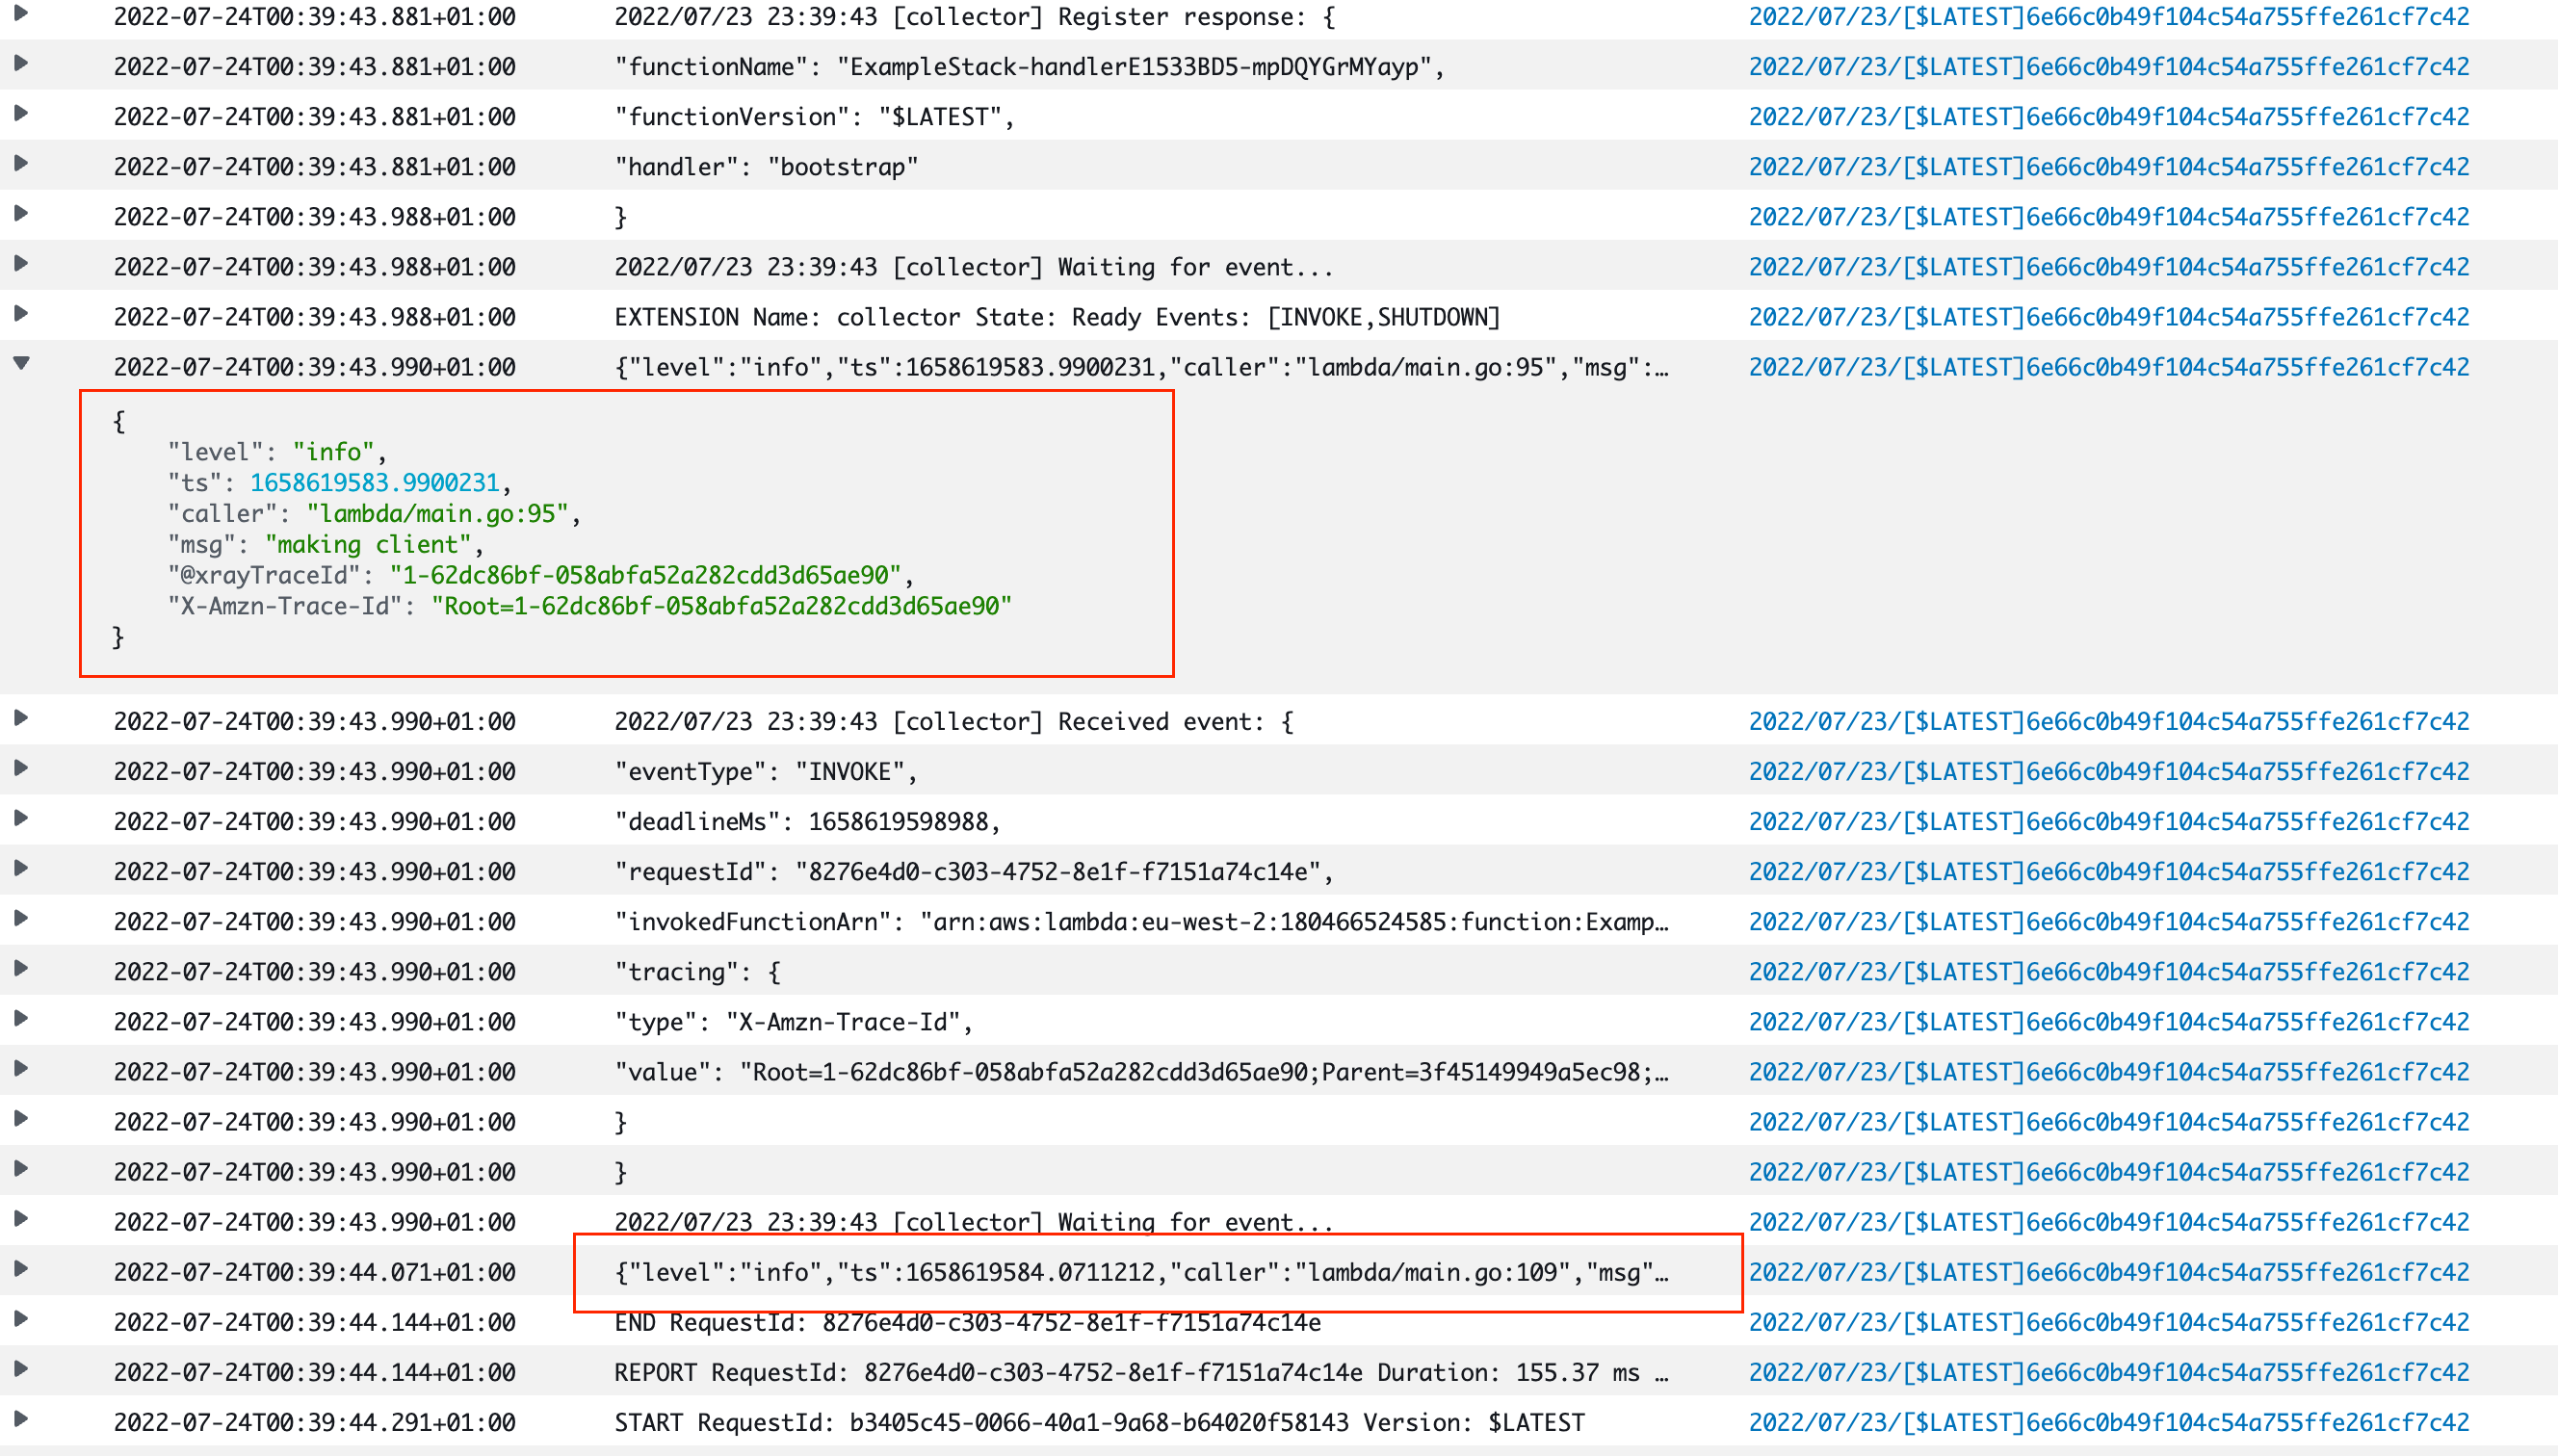
The current style of logging doesn't suit CloudWatch either, since it logs way too many lines.
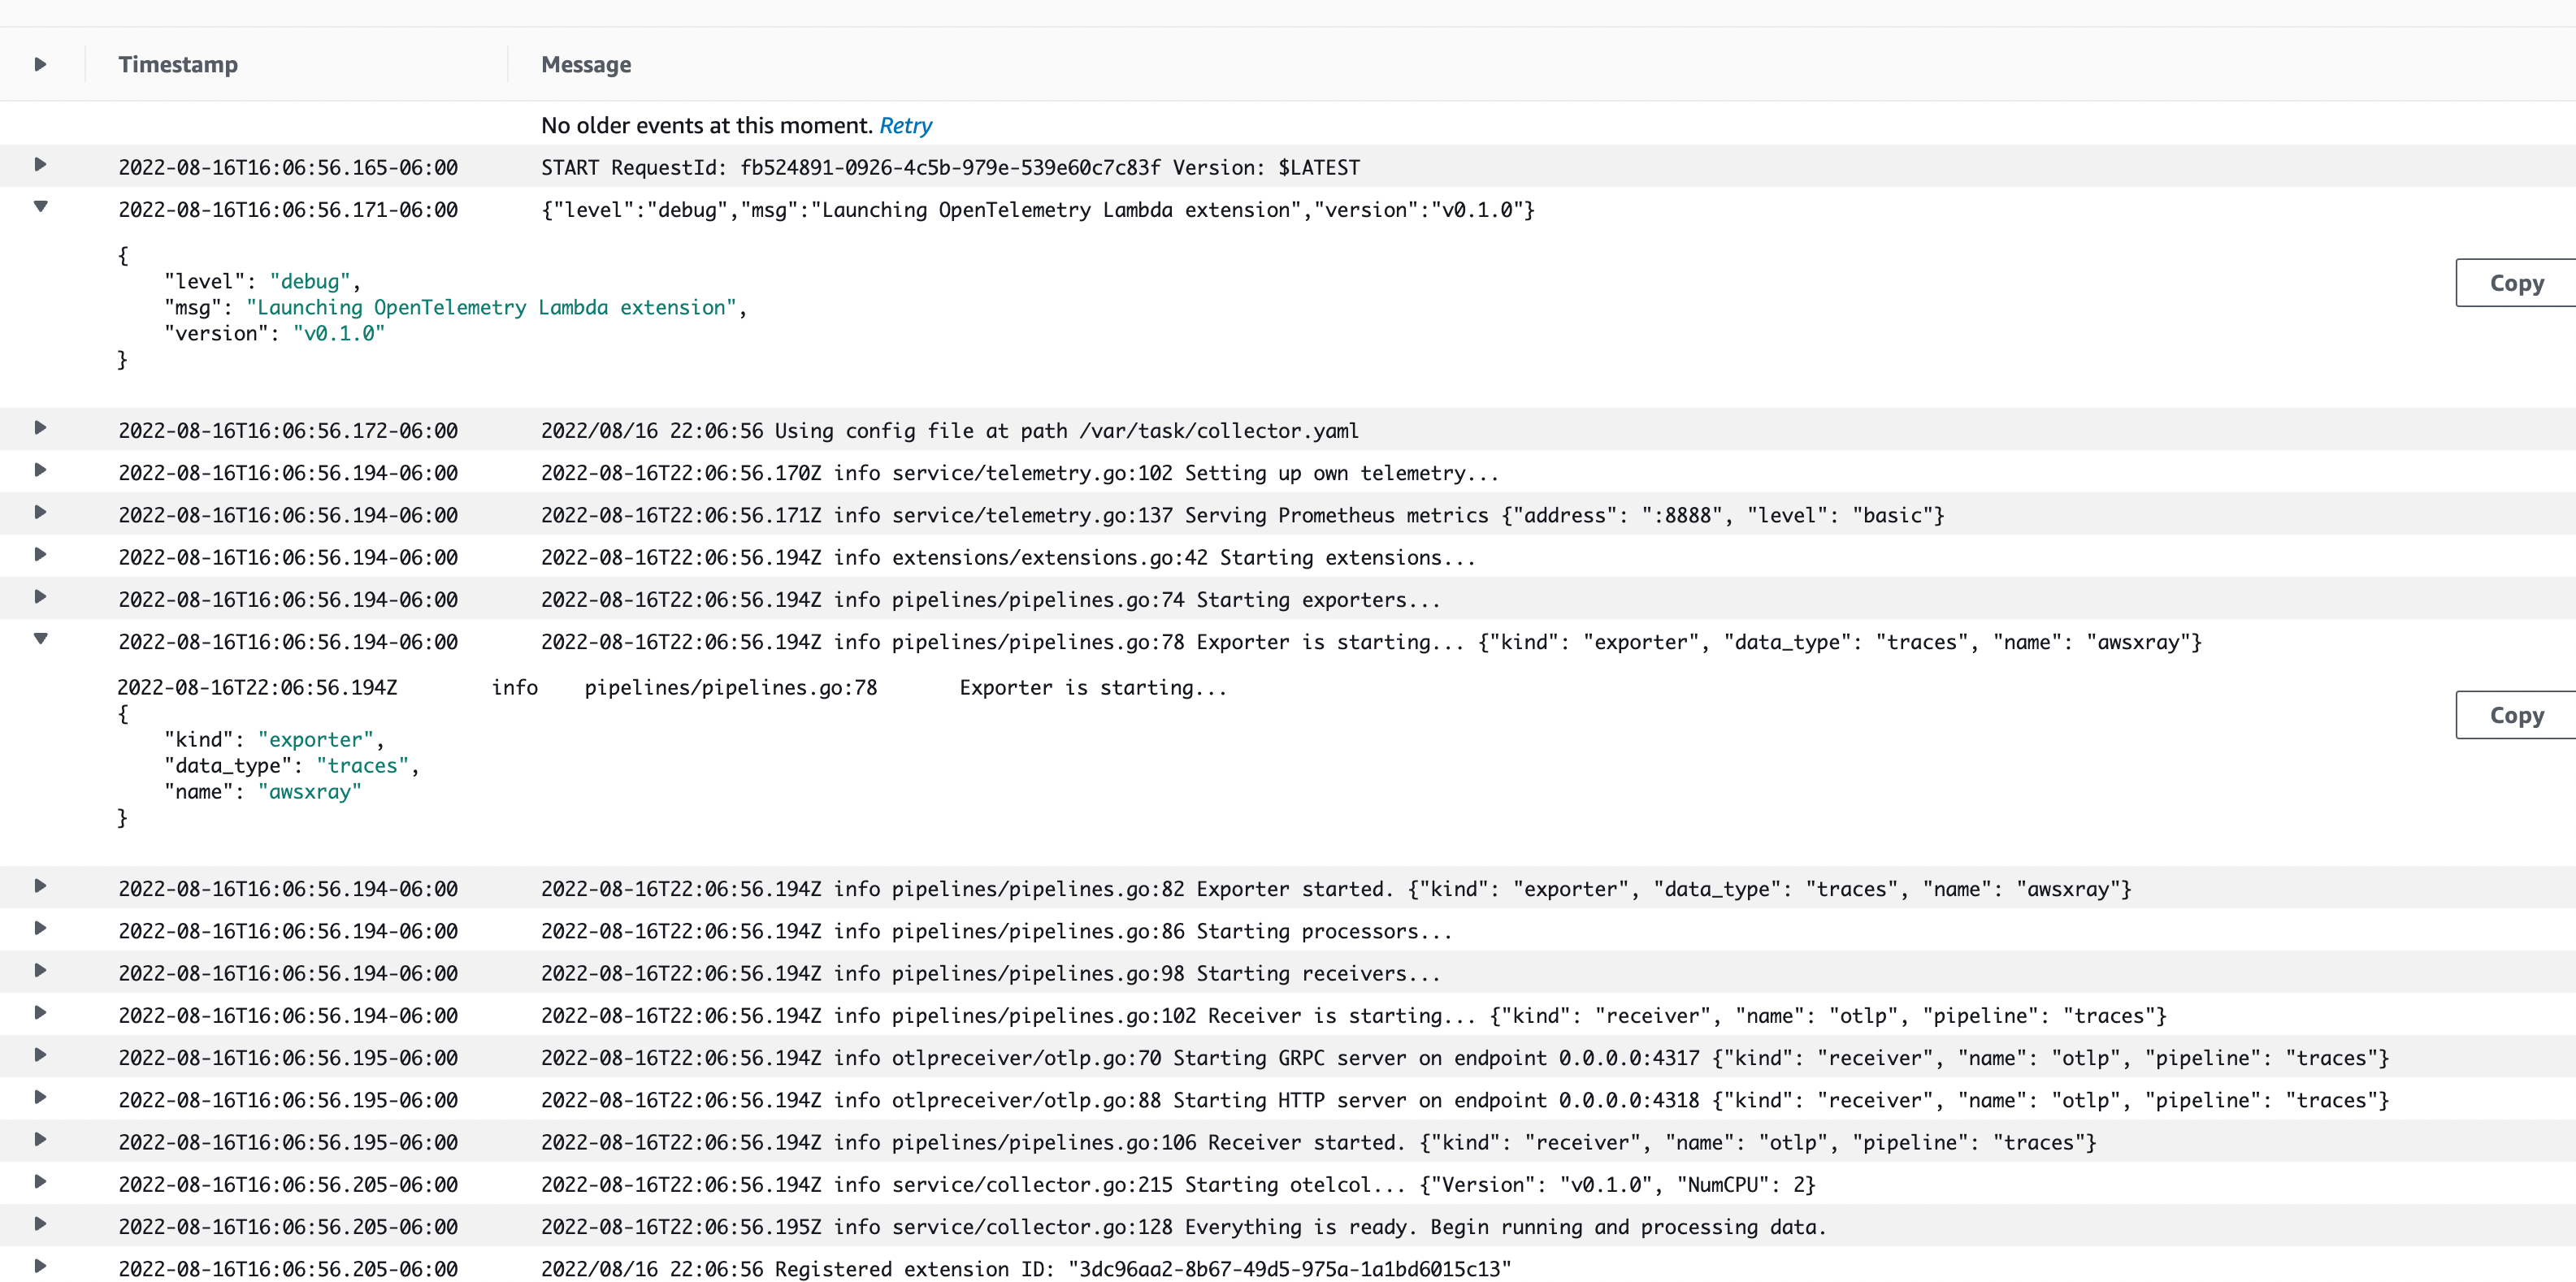
Using a single line of JSON works much better (e.g. by using something like Uber's zap library - https://github.com/uber-go/zap for structured logs). The display in CloudWatch Logs is better, and since the fields are JSON key/value pairs, CloudWatch Log Insights can automatically extract the fields for reporting and analysis.
Here's what the logs currently look like. I've highlighted in red my application's logging, vs what this tool is doing.
HI Thanks for the detailed response along with the issue. This issue is addressed in https://github.com/open-telemetry/opentelemetry-lambda/pull/236
Thanks, I've raised a PR to use zap consistently throughout, since there's still some log.Printf style things in there - https://github.com/open-telemetry/opentelemetry-lambda/pull/266
Hi @vasireddy99, how does your pr solve the op's issue? How can I change the logLevel for the extension? Thanks
Hi @vasireddy99, how does your pr solve the op's issue? How can I change the logLevel for the extension? Thanks
PR makes the collector extension logs to show up only when the loglevel:debug is set for the logging exporter in the config file.
@vasireddy99 Unfortunately, this doesnt work for me, after raising the loglevel, collector logs are gone, but still plenty of extension debug logs. How do you pass the loglevel to the zap? In your PR i can see you're initializing it through zap.NewExample() which sets the level as debug.
Not sure the latest changes helped in my case. I am just using x-ray exporter for tracing no metrics and no logging still seeing lambda lawyer setting loglevel:debug in logs and i can not override in collector config for x-ray. I noticed cluster log are less compare to before.
@goyatparmod Its because the loglevel is not configurable. There is a PR that adresses that (https://github.com/open-telemetry/opentelemetry-lambda/pull/273)