opentelemetry-js
 opentelemetry-js copied to clipboard
Using ZoneContextManager and FetchInstrumentation in browser causes lots of leaked Promises
What version of OpenTelemetry are you using?
"@opentelemetry/api": "^1.1.0",
"@opentelemetry/context-zone": "^1.3.0",
"@opentelemetry/core": "^1.3.0",
"@opentelemetry/exporter-trace-otlp-http": "^0.29.1",
"@opentelemetry/instrumentation-fetch": "^0.29.1",
"@opentelemetry/sdk-trace-base": "^1.3.0",
"@opentelemetry/semantic-conventions": "^1.3.0",
What version of Node are you using?
Not using Node, using Chrome Version 102.0.5005.63 (Official Build) (64-bit) on Windows 10.
Please provide the code you used to setup the OpenTelemetry SDK
See below.
What did you do?
This is in a React app.
Instantiate a tracer and an exporter, with ZoneContextManager, and add the FetchInstrumentation plugin.
What did you expect to see?
Fetch spans and traces.
What did you see instead?
Fetch spans and traces, and Promise leaks that pretty quickly grinds the process to a halt.
Additional context
How I instantiate the SDK:
import Logger from "../../../../common/src/client/Logger";
import {SamplingDecision} from "@opentelemetry/api";
import {Resource, ResourceAttributes} from "@opentelemetry/resources";
import {SemanticResourceAttributes} from "@opentelemetry/semantic-conventions";
import {
ConsoleSpanExporter,
BatchSpanProcessor,
BufferConfig,
SpanExporter,
} from "@opentelemetry/sdk-trace-base";
import {WebTracerConfig, WebTracerProvider} from "@opentelemetry/sdk-trace-web";
import {ZoneContextManager} from "@opentelemetry/context-zone";
import {registerInstrumentations} from "@opentelemetry/instrumentation";
import {FetchInstrumentation} from "@opentelemetry/instrumentation-fetch";
import {OTLPTraceExporter} from "@opentelemetry/exporter-trace-otlp-http";
export interface IWebTracerOptions {
// disable open telemetry tracing
disable?: boolean;
// annotations that go on the root spans
rootAnnotations?: ResourceAttributes;
// when tracing, configure parameters here
customerId: string;
accessToken: string;
tracingEndpoint?: string;
// override exporter, for unit testing
exporter?: SpanExporter;
processorOpts?: BufferConfig;
}
let provider: WebTracerProvider;
export function startOpenTelemetry(opts?: IWebTracerOptions): WebTracerProvider {
if (provider !== undefined) {
Logger.info("OpenTelemetry already started");
return provider;
}
// Figure out whether to disable collection for this session.
// We want to sample either everything in a given session, or nothing.
// Additionally, when disabled, tell the tracer to sample nothing.
let disable: boolean = opts?.disable || false;
Logger.info("Initializing OpenTelemetry");
const tracerConfig: WebTracerConfig = {};
const rootAnnotations: ResourceAttributes = {
[SemanticResourceAttributes.SERVICE_NAME]: "someapp",
[SemanticResourceAttributes.SERVICE_NAMESPACE]: "somename",
[SemanticResourceAttributes.SERVICE_INSTANCE_ID]: "someid",
[SemanticResourceAttributes.SERVICE_VERSION]: "0.0.0",
};
if (opts?.rootAnnotations) {
for (const [k, v] of Object.entries(opts.rootAnnotations)) {
rootAnnotations[k] = v;
}
}
tracerConfig.resource = new Resource(rootAnnotations);
if (disable) {
tracerConfig.sampler = {
shouldSample: () => {
return {decision: SamplingDecision.NOT_RECORD};
},
toString: () => "discarding sampler",
};
}
// we always allocate a provider, but it may not be doing much if we're disabled
provider = new WebTracerProvider(tracerConfig);
if (!disable) {
const exporter: SpanExporter = chooseExporter(opts);
const processorOpts: BufferConfig = opts?.processorOpts || {
maxExportBatchSize: 100,
scheduledDelayMillis: 500,
exportTimeoutMillis: 20000,
maxQueueSize: 1000,
};
provider.addSpanProcessor(new BatchSpanProcessor(exporter, processorOpts));
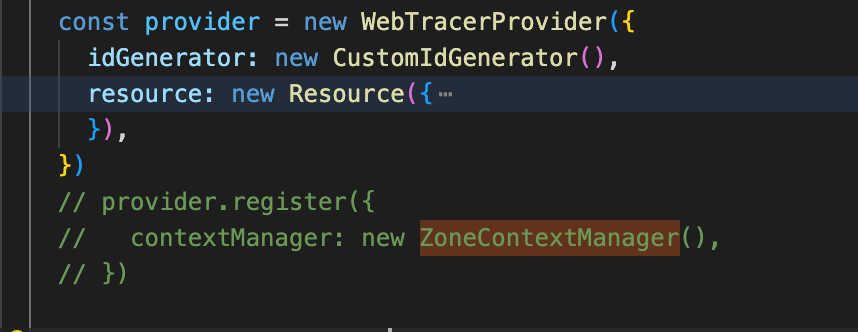
provider.register({
contextManager: new ZoneContextManager(),
});
const fetchInstrumentation = new FetchInstrumentation({
ignoreUrls: [/.*collect\.service.*/],
});
// Registering instrumentations / plugins
registerInstrumentations({
instrumentations: [fetchInstrumentation],
});
Logger.info("Started OpenTelemetry");
} else {
Logger.info("OpenTelemetry is disabled");
}
return provider;
}
function chooseExporter(opts?: IWebTracerOptions): SpanExporter {
let exporter: SpanExporter;
if (opts?.exporter) {
Logger.info("Using provided SpanExporter");
exporter = opts.exporter;
} else if (opts?.tracingEndpoint && opts?.customerId && opts?.accessToken) {
Logger.info(`Using OTLPTraceExporter to ${opts.tracingEndpoint}`);
const cid = opts.customerId;
const authtoken = opts.accessToken;
exporter = new OTLPTraceExporter({
url: opts.tracingEndpoint,
headers: {
"Content-Type": "application/json",
Authorization: `Bearer ${cid} ${authtoken}`,
},
concurrencyLimit: 3,
});
} else {
Logger.info("Using ConsoleSpanExporter");
exporter = new ConsoleSpanExporter();
}
return exporter;
}
Can you provide a minimal reproduction for this? It is hard to look at an entire instrumentation and see a memory leak. It may be caused by a particular option or method that is called.
That would be a pretty heavy lift. Let me see what I can do, it may take some time.
I'm sorry. I assumed since you had already narrowed your leak down to the fetch instrumentation that you had some idea of the cause. I really just wanted to know if the leak is in the "happy path" or if your application is doing anything unusual or esoteric that may be causing the leak.
@jwatte I have started looking at this, and I am not seeing a significant overhead when making ~1000 fetch calls. Can you please provide a little more details on how to reproduce this? How did you come to the conclusion that the issue is with the fetch instrumentation and/or promises?
@jwatte I have started looking at this, and I am not seeing a significant overhead when making ~1000 fetch calls. Can you please provide a little more details on how to reproduce this? How did you come to the conclusion that the issue is with the fetch instrumentation and/or promises?
I encountered the same problem, but I don't know how to troubleshoot it? At present, the package can work normally as long as the page is commented out, otherwise it will get stuck
Sorry, after analysis, it was found that the page crash was caused by the micro front-end application. We used the qiankun framework and initialized the sub application. The sub application will crash after the route switch. It is speculated that it was caused by multiple initializations
It turns out that the real reason for this, is that ZoneContextManager does not instrument async/await calls, only manual promises. Our code has been using a mixture of both. The work-around is to make the TypeScript compiler lower to ES3, so async/await turns into manual promises.
I would suggest that the documentation should mention, front-and-center, that any use of async/await won't be instrumented, and will lead to problems.
So @jwatte you end up using just the default context manager that WebTracerProvider provides?
Are there any plans to make the ZoneContextManager work in ES2017+ ?
Given that Zone.js doesn't support async/await, it seems unlikely to me that ZoneContextManager will gain support. Monkey-patching Promise.prototype.then doesn't seem to affect async functions, as demonstrated by the following script:
const promiseThen = Promise.prototype.then;
Promise.prototype.then = function(...args) { console.debug('then'); return promiseThen.call(this, ...args); }
// Uses patched then()
Promise.resolve(1).then(v => console.debug(v));
// Doesn't use patched then()
(async () => { const val = await Promise.resolve(2); console.debug(val); })();