opentelemetry-collector-contrib
 opentelemetry-collector-contrib copied to clipboard
prometheusreceiver: allow to disable start time calculation
Description: <Describe what has changed.>
Allow to disable start time calculation, which is unnecessary in prometheus world and saves a lot of memory usage and avoid potential memory leak (from jobsMap I guess ?), more details can be found in the comment in following issue.
Link to tracking Issue: <Issue number if applicable> https://github.com/open-telemetry/opentelemetry-collector-contrib/issues/9998#issuecomment-1178752819
Testing: <Describe what testing was performed and which tests were added.> n/a
Documentation: <Describe the documentation added.> comment for the new config
config.go:57: File is not `gofmt`-ed with `-s` (gofmt)
 	// DisableStartTime disables start time calculation of all metrics, which significantly reduces the memory usage of the receiver.
 	// Removing the start timestamp may limit the ability of other components and backends to offer full functionality with these metrics.
@djaglowski this is another example where I could merge even if lint is failing:
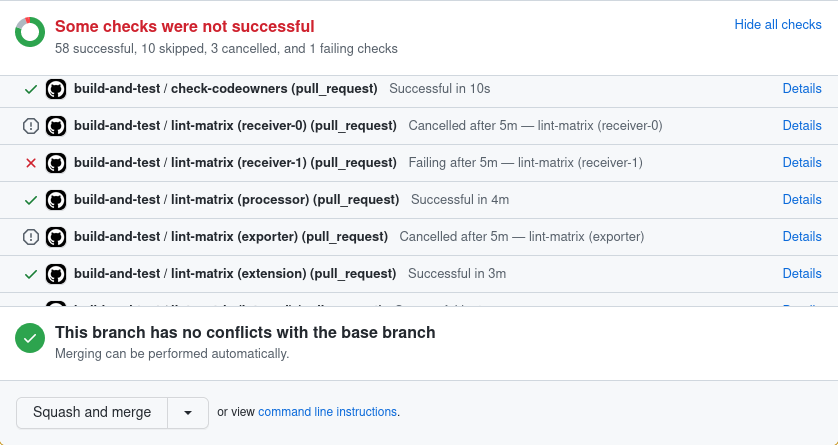
I see what you are saying. The lint check was skipped, so it should not yet be possible to merge.
I'll look into this. Maybe there is a branch protection rule that should be stopping this.
I am sure @jmacd can clear this up better than me, but I think it is optional based on the following statements on that same data model document:
Every OTLP metric data point has two associated timestamps. [...]The second, optional timestamp is used to indicate when a sequence of points is unbroken, and is referred to as StartTimeUnixNano.
The second timestamp is strongly recommended for Sum, Histogram, and ExponentialHistogram points [...]
When the StartTimeUnixNano field is present, it allows [...]
StartTimeUnixNano is recommended so that [...]
I agree that we need to warn about this loudly, and we should never have this option enabled by default, but if the spec allows it I don't see a reason to reject this PR (once we have a shared understanding of this)
Load test failure is irrelevant to this PR
--- FAIL: TestTraceAttributesProcessor (0.81s)
    --- FAIL: TestTraceAttributesProcessor/JaegerGRPC (0.01s)
    --- PASS: TestTraceAttributesProcessor/OTLP (0.80s)
FAIL
exit status 1
FAIL	github.com/open-telemetry/opentelemetry-collector-contrib/testbed/tests	0.852s
# Test PerformanceResults
Started: Thu, 21 Jul 2022 00:08:56 +0000
Test                                    |Result|Duration|CPU Avg%|CPU Max%|RAM Avg MiB|RAM Max MiB|Sent Items|Received Items|
----------------------------------------|------|-------:|-------:|-------:|----------:|----------:|---------:|-------------:|
TraceAttributesProcessor/JaegerGRPC     |FAIL  |      0s|     0.0|     0.0|          0|          0|         1|             1|signal: terminated
TraceAttributesProcessor/OTLP           |PASS  |      1s|     0.0|     0.0|          0|          0|         3|             3|
Total duration: 1s
make: *** [Makefile:9: run-tests] Error 1
make: Leaving directory '/home/runner/work/opentelemetry-collector-contrib/opentelemetry-collector-contrib/testbed'
Error: Process completed with exit code 2.
bump @jmacd PTAL at @Aneurysm9's comment https://github.com/open-telemetry/opentelemetry-collector-contrib/pull/12215#pullrequestreview-1034909018
I'm concerned that we're offering an easy way to break the OTel data model instead of fixing a memory leak. Consumers who are concerned with correct rate calculations will suffer for this change. Has any investigation been done on simply fixing the leak?
I'm concerned that we're offering an easy way to break the OTel data model instead of fixing a memory leak.
I don't think we've seen any evidence of a leak thus far, just high overall memory usage. I'll try and set up a quick soak test (with always-changing metrics) to see if I can find a leak and report back. If it isn't a leak, and tracking start time is just very expensive, then being able to disable it seems reasonable, since not all (e.g. prometheus) exporters need the start time.
@jmacd can you clarify when start time is/isn't required? My reading of the spec is that it is required for OTel SDKs, but only recommended in the protocol, etc. It isn't clear if exporters can/should rely on the presence of start time, or if they need to be able to handle metrics without start time set.
I have a soak test running now. It generates 100 new series each scrape (and stops emitting the old series), which should eventually make the collector OOM if there is a leak.
I have a soak test running now. It generates 100 new series each scrape (and stops emitting the old series), which should eventually make the collector OOM if there is a leak.
I don't think it is a general memory leak, or it is not occuring in all use cases.
Because if so, it would have leaked on every machine of ours because windows_exporter process metrics come and go (as soon as the PID is gone) all the time.
I only observed it on our machines running quite a lot of metrics on one instance, as described in #9998 , and have the feeling the significant memory increase happens when many **histograms ** are added to the scrapes.
Also I am ONLY running on WINDOWS systems, so its possible my issue may not occur on linux, but other users include kubernetes which I don't think they run on windows.
My test seems to confirm that as well. Memory has stayed constant for the past 12 hours.
My test seems to confirm that as well. Memory has stayed constant for the past 12 hours.
It generates 100 new series each scrape
@dashpole What kind of series? Counter, Gauge, ... Try modifying your test so it also adds new histograms, having different count and sizes of buckets, and alle added series should have several different label names and label values. Label values should have at least "medium" length.
Does your test run on linux or windows?
I could still provide our original metrics text data (saved during increasing memory consumption), if your debugging could ingest them? I guess it should be easily doable to expose them, e.g. by node_exporter text_file collector?
I dunno if our label values are unreasonably long. Here are a few examples, of series that are later added during runtime of our app. Some labels have been already added bei OTELCOL.
ax_service_data_serverplugin_query_duration_seconds_bucket{app="AX.Server.Service",context="Scheduler",instance="localhost:18086",instance_origin="localhost:18086",job="localmetrics",path="GLOBAL.Instance.FunctionClasses.InformationManagement.Timer.UserAlarmTimer.UserAlarmQueue",schema="DATA.Instance.BaseClasses.SqlSchemaSystem",le="16"} 11172
(4 buckets total, hundreds of unique histograms by path)
ax_service_system_deploy_prepare_duration_seconds_bucket{app="AX.Server.Service",device_id="PLC.Instance.PS.1003.aXController",instance="localhost:18086",instance_origin="localhost:18086",job="localmetrics",le="10"} 2
(2 buckets total, hundres of unique histograms by device_id
ax_service_client_viewer_update_cache_synchronization_duration_seconds_bucket{app="AX.Server.Service",application_name="IDE",instance="localhost:18086",instance_origin="localhost:18086",job="localmetrics",terminal="<NotSet>",le="60"} 3
(8 buckets total, dozens of unique histograms by terminal)
They are all counter series. If there was a leak in the garbage collection, those should demonstrate it.
Label length shouldn't matter too much. We just care about start time tracking, which is done for all cumulative types (counter, histogram, summary)
If this is not a leak, I would still like an explanation for why memory usage is so high in this module. My understanding is that a Prometheus receiver would be required to keep O(1) memory per active timeseries with or without start timestamps, in order to track staleness, so that adding a timestamp should add a cost of around O(8 bytes) extra in an existing structure.
It is mostly a code design problem. Staleness is tracked in the prometheus library, and we track the start time separately in the prometheus receiver. It is probably also an indication that our implementation is quite inefficient, and could be optimized.
Looking at the prom implementation of staleness, it looks like a label set has a Hash() function that it uses to track each series. We keep the entire OTLP representation of the initial points, which is probably larger? It also only tracks the current and previous scrape, rather than all series. So there are probably optimizations we can make to make that less expensive.
Yeah, fingerprinting is a pretty serious optimization for SDKs to make as well, as it can reduce allocations significantly. I recently applied such an optimization to the Lighstep metrics SDK, here's the code used: https://github.com/lightstep/otel-launcher-go/tree/main/lightstep/sdk/metric/internal/fprint
It's worth noting that hash collisions would presumably exhibit some incorrectness; for the SDK linked above, I still detect collisions and ensure correctness despite collisions, so there are different middle grounds here.
This PR was marked stale due to lack of activity. It will be closed in 14 days.
I've opened https://github.com/open-telemetry/opentelemetry-collector-contrib/issues/13451 to track the fingerprinting improvement discussed above.
This PR was marked stale due to lack of activity. It will be closed in 14 days.
Closed as inactive. Feel free to reopen if this PR is still being worked on.