mmpose
 mmpose copied to clipboard
Published
20 hours ago •
 open-mmlab
add chart alongside to the inference speed table
trafficstars
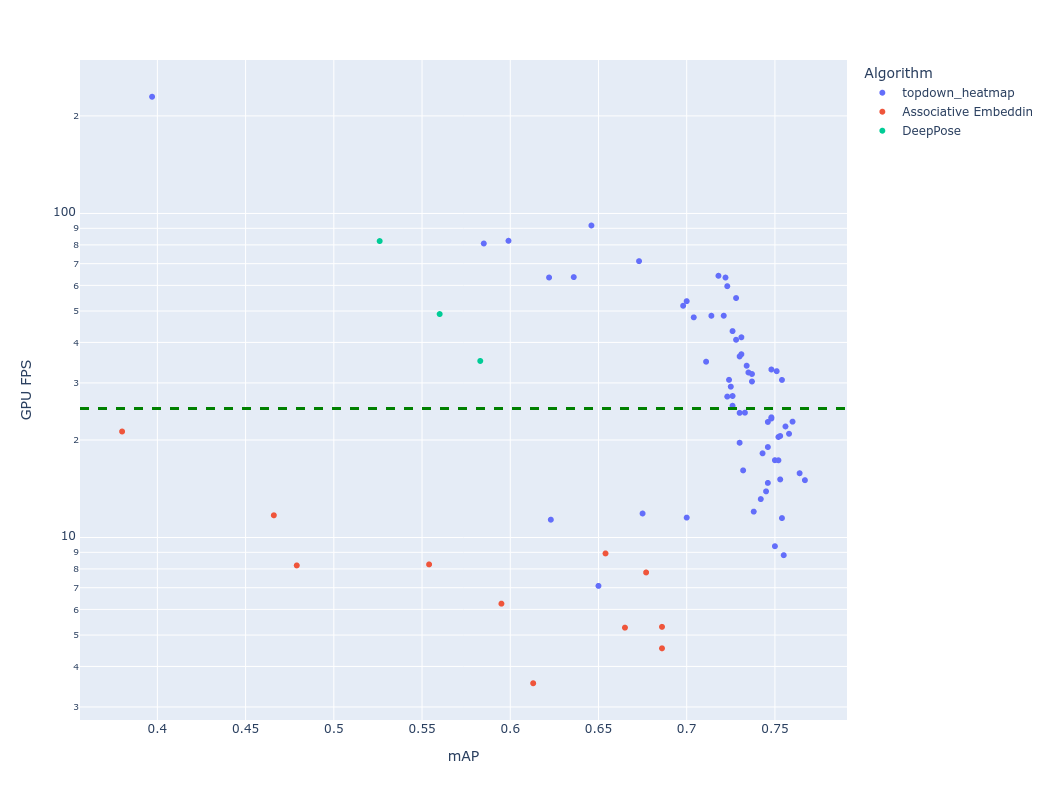
I've plotted the https://mmpose.readthedocs.io/en/latest/inference_speed_summary.html to have a meaningful insight into the data.
import pandas as pd
import plotly.express as px
df = pd.read_html('https://mmpose.readthedocs.io/en/latest/inference_speed_summary.html')[0]
df[['GPU FPS', 'GPU FPS stderr']] = df['GPU Inference Speed(FPS)1'].str.split(' ± ', expand=True)
df['GPU FPS'] = df['GPU FPS'].astype(float)
fig = px.scatter(df, x='mAP', y='GPU FPS', color='Algorithm', height=800, hover_data=['Algorithm', 'Model', 'Input size'], log_y=True)
fig.add_hline(y=25, line_width=3, line_dash="dash", line_color="green") # realtime line
fig.show()
# fig.write_html("mmpose_benchmarks.html")
It would be nice to see similar chart added.
Thank you for your helpful advice! The chart looks clear and intuitive, which can visually show the trade-off between mAP and FPS. Would you like to raise a PR to add these useful codes into mmpose?