nft.storage
 nft.storage copied to clipboard
feat: fetch and calculate stats from NFTPort
BLOCKED: Awaiting NFTPort fix on their market data
Fixes #1963 This PR fetches market stats from NFTPort and displays them on the /stats page.
Deploying with  Cloudflare Pages
| Latest commit: |
86d483e
|
| Status: | ✅ Deploy successful! |
| Preview URL: | https://a98398dd.nft-storage-1at.pages.dev |
| Branch Preview URL: | https://feat-market-stats-from-nft-p.nft-storage-1at.pages.dev |
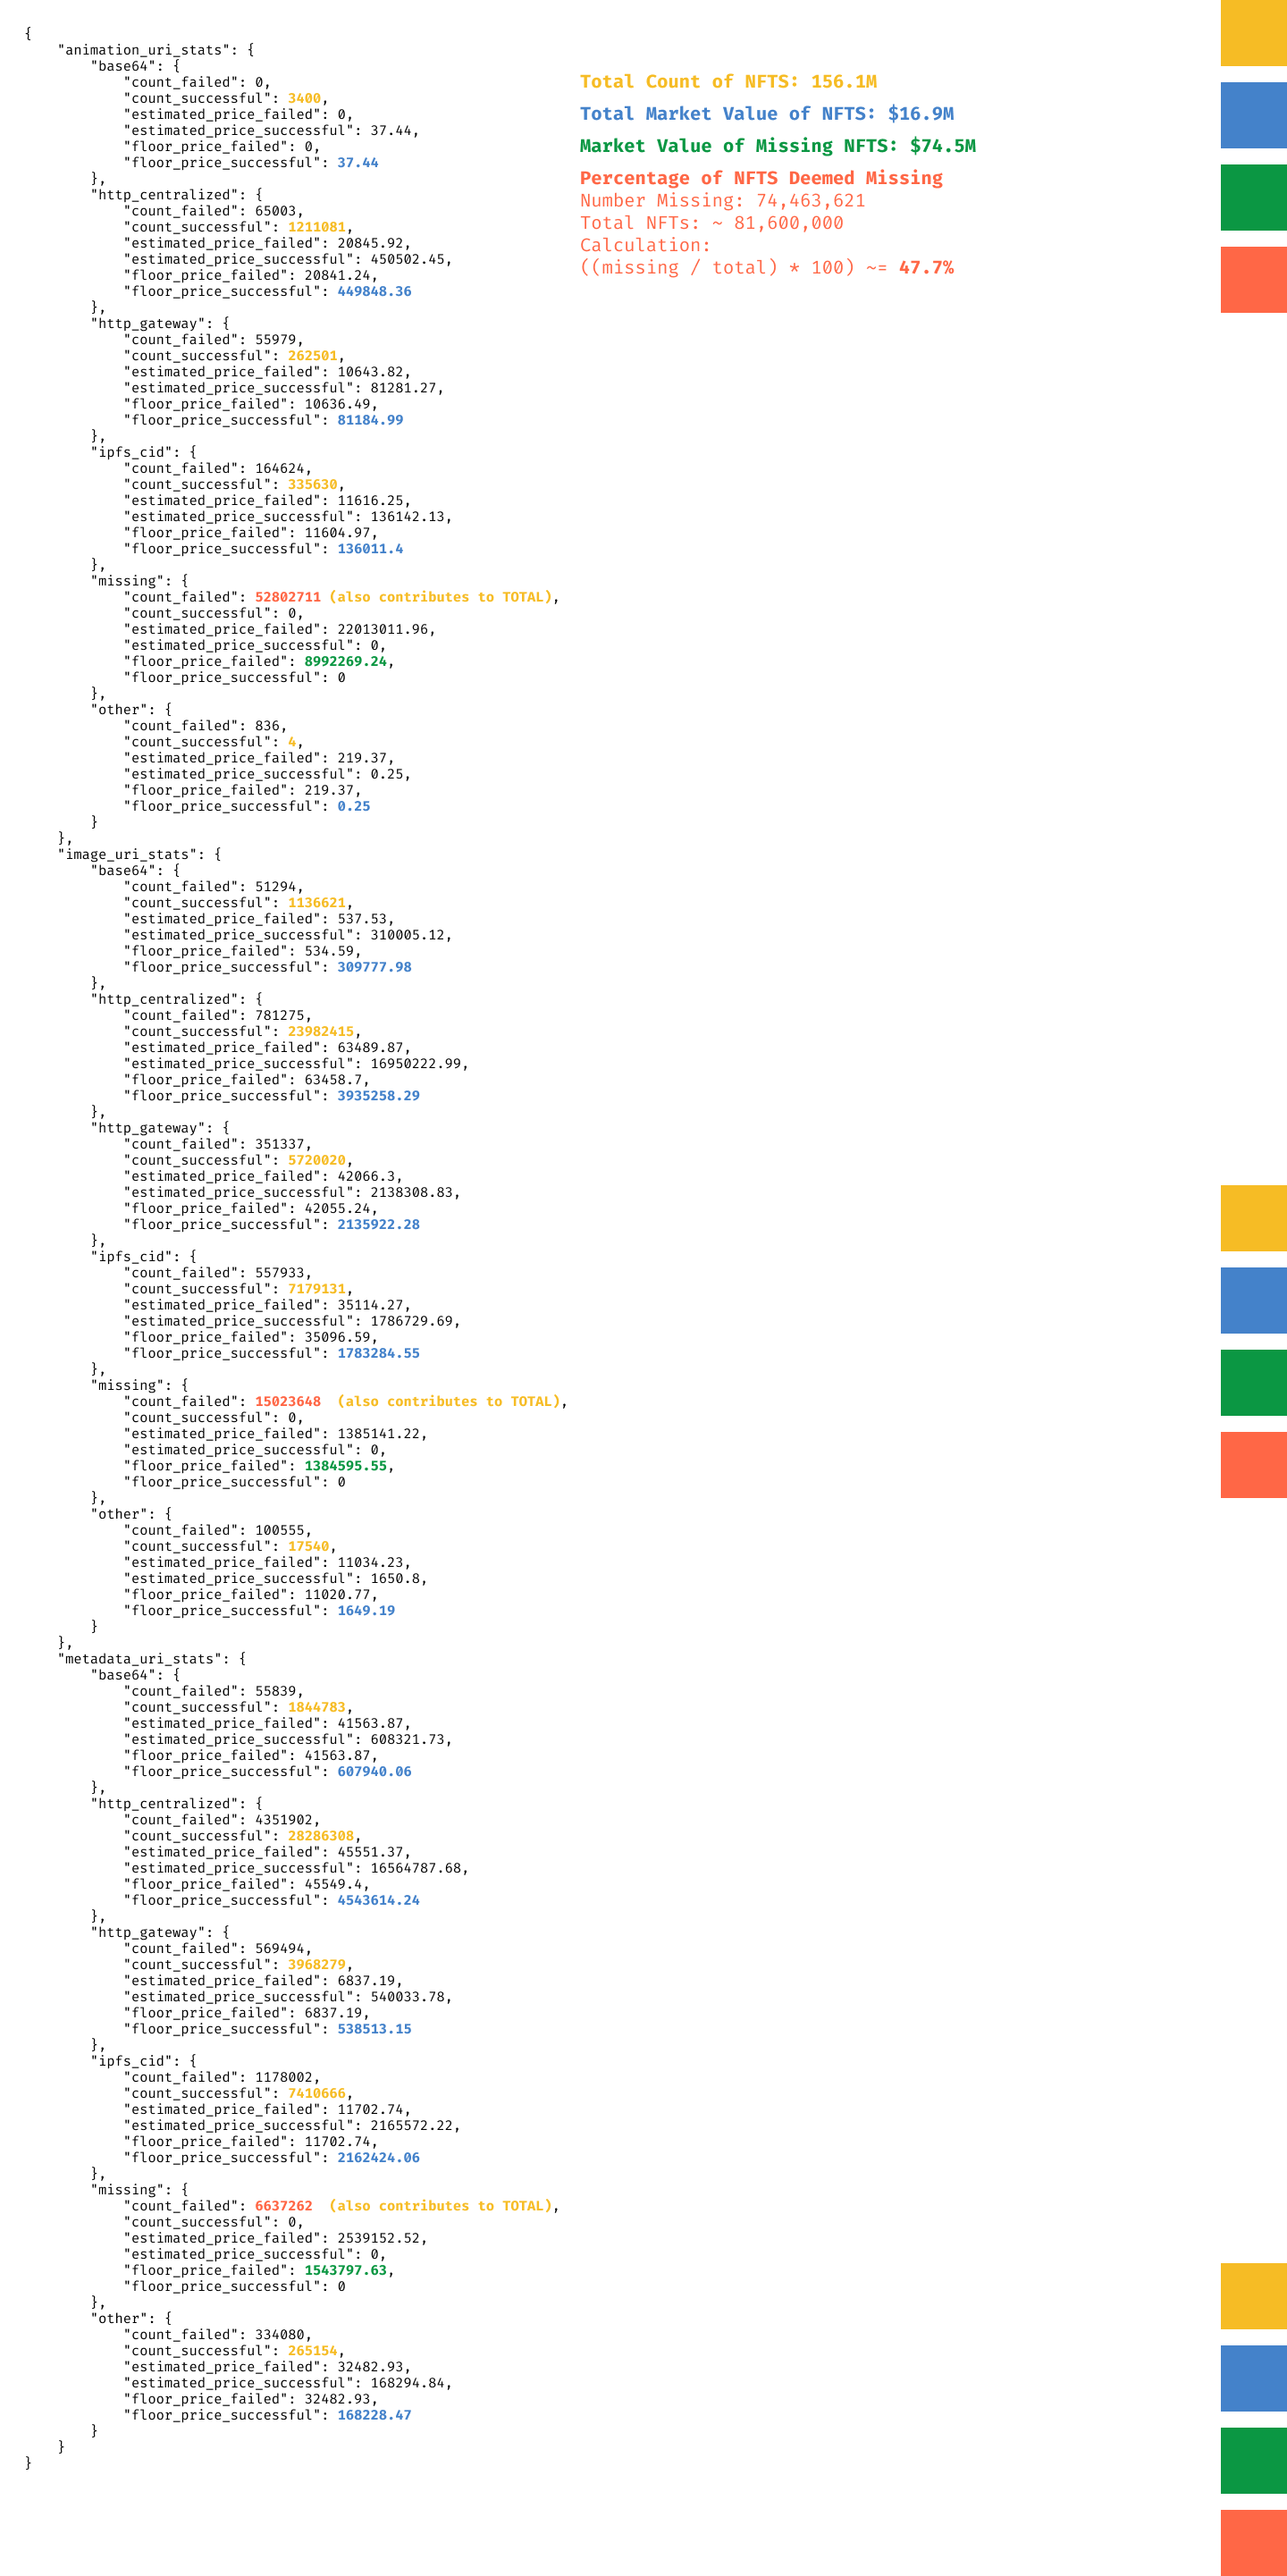
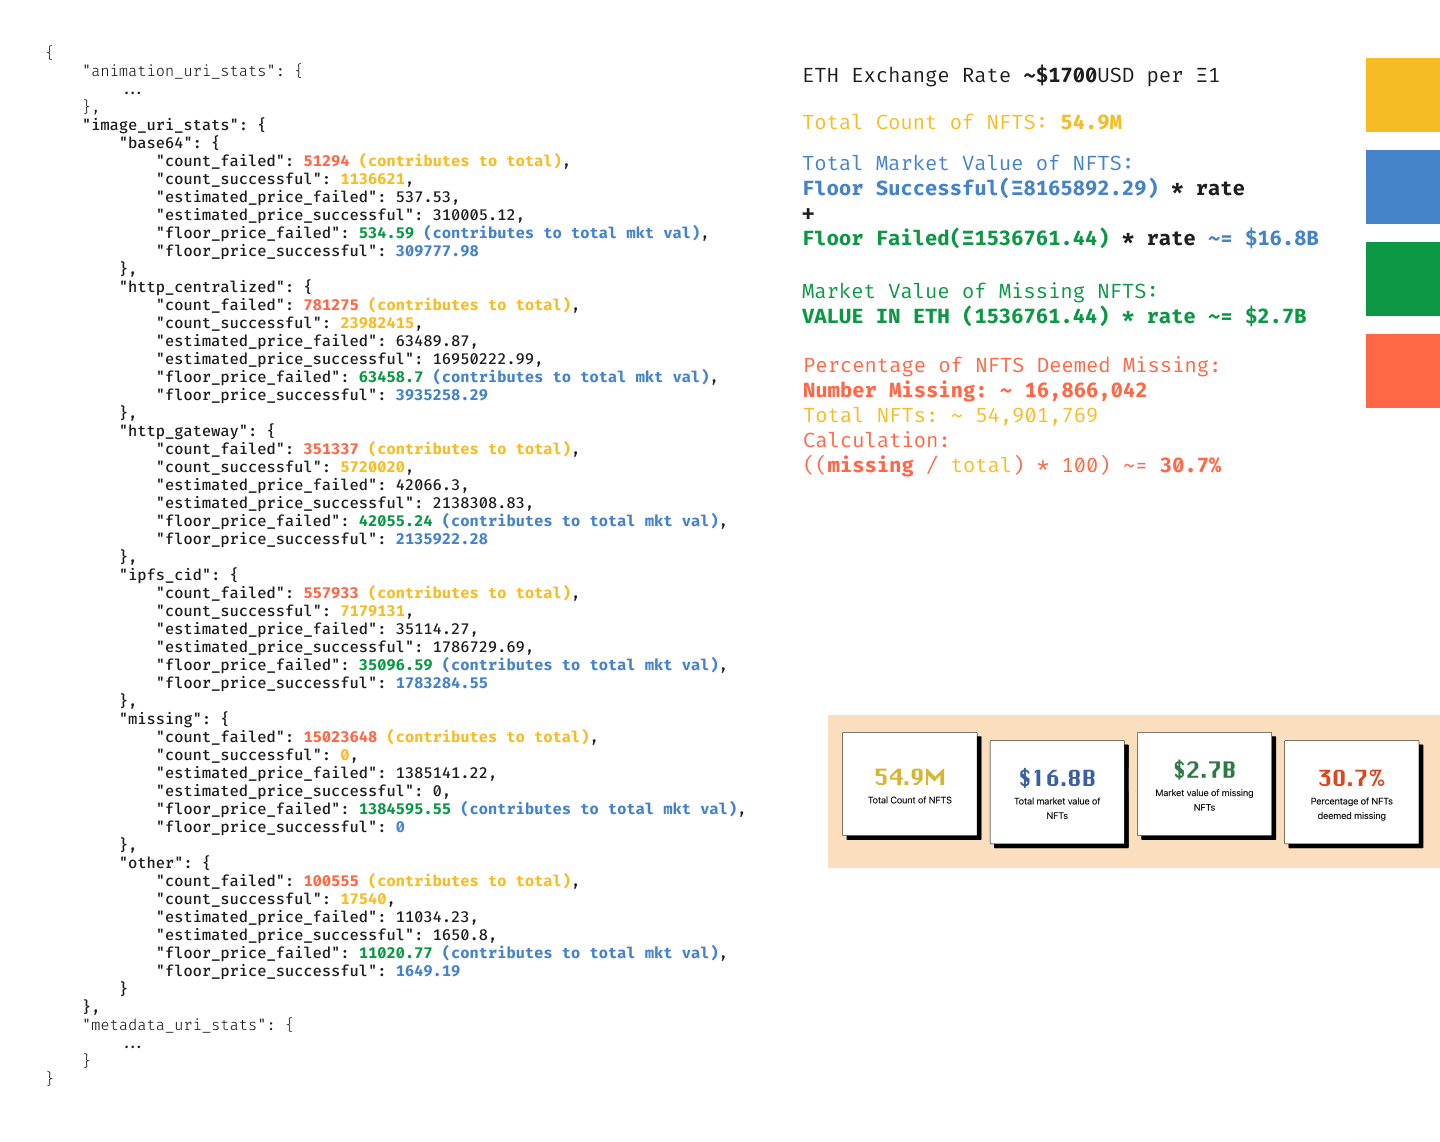
Here is an infographic of sorts on where I am puling the data. On the left is the JSON we get back from NFT Port and color-coded mappings to how I sum up each calculation. Hope this visual helps.

FYI here is the response JSON
{
    "response": "OK",
    "report": {
        "animation_uri_stats": {
            "base64": {
                "count_failed": 0,
                "count_successful": 3400,
                "estimated_price_failed": 0,
                "estimated_price_successful": 37.44,
                "floor_price_failed": 0,
                "floor_price_successful": 37.44
            },
            "http_centralized": {
                "count_failed": 65003,
                "count_successful": 1211081,
                "estimated_price_failed": 20845.92,
                "estimated_price_successful": 450502.45,
                "floor_price_failed": 20841.24,
                "floor_price_successful": 449848.36
            },
            "http_gateway": {
                "count_failed": 55979,
                "count_successful": 262501,
                "estimated_price_failed": 10643.82,
                "estimated_price_successful": 81281.27,
                "floor_price_failed": 10636.49,
                "floor_price_successful": 81184.99
            },
            "ipfs_cid": {
                "count_failed": 164624,
                "count_successful": 335630,
                "estimated_price_failed": 11616.25,
                "estimated_price_successful": 136142.13,
                "floor_price_failed": 11604.97,
                "floor_price_successful": 136011.4
            },
            "missing": {
                "count_failed": 52802711,
                "count_successful": 0,
                "estimated_price_failed": 22013011.96,
                "estimated_price_successful": 0,
                "floor_price_failed": 8992269.24,
                "floor_price_successful": 0
            },
            "other": {
                "count_failed": 836,
                "count_successful": 4,
                "estimated_price_failed": 219.37,
                "estimated_price_successful": 0.25,
                "floor_price_failed": 219.37,
                "floor_price_successful": 0.25
            }
        },
        "image_uri_stats": {
            "base64": {
                "count_failed": 51294,
                "count_successful": 1136621,
                "estimated_price_failed": 537.53,
                "estimated_price_successful": 310005.12,
                "floor_price_failed": 534.59,
                "floor_price_successful": 309777.98
            },
            "http_centralized": {
                "count_failed": 781275,
                "count_successful": 23982415,
                "estimated_price_failed": 63489.87,
                "estimated_price_successful": 16950222.99,
                "floor_price_failed": 63458.7,
                "floor_price_successful": 3935258.29
            },
            "http_gateway": {
                "count_failed": 351337,
                "count_successful": 5720020,
                "estimated_price_failed": 42066.3,
                "estimated_price_successful": 2138308.83,
                "floor_price_failed": 42055.24,
                "floor_price_successful": 2135922.28
            },
            "ipfs_cid": {
                "count_failed": 557933,
                "count_successful": 7179131,
                "estimated_price_failed": 35114.27,
                "estimated_price_successful": 1786729.69,
                "floor_price_failed": 35096.59,
                "floor_price_successful": 1783284.55
            },
            "missing": {
                "count_failed": 15023648,
                "count_successful": 0,
                "estimated_price_failed": 1385141.22,
                "estimated_price_successful": 0,
                "floor_price_failed": 1384595.55,
                "floor_price_successful": 0
            },
            "other": {
                "count_failed": 100555,
                "count_successful": 17540,
                "estimated_price_failed": 11034.23,
                "estimated_price_successful": 1650.8,
                "floor_price_failed": 11020.77,
                "floor_price_successful": 1649.19
            }
        },
        "metadata_uri_stats": {
            "base64": {
                "count_failed": 55839,
                "count_successful": 1844783,
                "estimated_price_failed": 41563.87,
                "estimated_price_successful": 608321.73,
                "floor_price_failed": 41563.87,
                "floor_price_successful": 607940.06
            },
            "http_centralized": {
                "count_failed": 4351902,
                "count_successful": 28286308,
                "estimated_price_failed": 45551.37,
                "estimated_price_successful": 16564787.68,
                "floor_price_failed": 45549.4,
                "floor_price_successful": 4543614.24
            },
            "http_gateway": {
                "count_failed": 569494,
                "count_successful": 3968279,
                "estimated_price_failed": 6837.19,
                "estimated_price_successful": 540033.78,
                "floor_price_failed": 6837.19,
                "floor_price_successful": 538513.15
            },
            "ipfs_cid": {
                "count_failed": 1178002,
                "count_successful": 7410666,
                "estimated_price_failed": 11702.74,
                "estimated_price_successful": 2165572.22,
                "floor_price_failed": 11702.74,
                "floor_price_successful": 2162424.06
            },
            "missing": {
                "count_failed": 6637262,
                "count_successful": 0,
                "estimated_price_failed": 2539152.52,
                "estimated_price_successful": 0,
                "floor_price_failed": 1543797.63,
                "floor_price_successful": 0
            },
            "other": {
                "count_failed": 334080,
                "count_successful": 265154,
                "estimated_price_failed": 32482.93,
                "estimated_price_successful": 168294.84,
                "floor_price_failed": 32482.93,
                "floor_price_successful": 168228.47
            }
        }
    },
    "error": null
}
Got some good feedback from the NFTPort team. Will rework our calculations accordingly.
The latest numbers are updated per the feedback form the NFTPort team. Here is an updated infographic on what numbers I used to determine the values.

Tavio (NFTPort) confirmed that the aggregation calculations look correct! We're good to proceed with this.
@JeffLowe we noticed what appeared to be visual overflow issues in the stats section. After looking further, I am noticing higher-than-expected market value numbers coming back from the NFTPort api. Can we confirm that these are correct and in what currency they are sending?
Most relevant for our calculations, the floor_price_failed and floor_price_successful fields are much higher than previously seen so we are seeing sums in the quadrillions.
"image_uri_stats": {
      "base64": {
        "count_failed": 21665,
        "count_successful": 1829928,
        "estimated_price_failed": 594.46,
        "estimated_price_successful": 1900000000178527.2,
        "floor_price_failed": 591.66,
        "floor_price_successful": 1900000000178086.8
      },
      "http_centralized": {
        "count_failed": 794877,
        "count_successful": 30564210,
        "estimated_price_failed": 23312713.94,
        "estimated_price_successful": 124034512.88,
        "floor_price_failed": 23312659.71,
        "floor_price_successful": 111421736.55
      },
      "http_gateway": {
        "count_failed": 169187,
        "count_successful": 11339746,
        "estimated_price_failed": 98891.01,
        "estimated_price_successful": 220273488.34,
        "floor_price_failed": 98889.19,
        "floor_price_successful": 220270610.69
      },
      "ipfs_cid": {
        "count_failed": 350528,
        "count_successful": 24876339,
        "estimated_price_failed": 196242014475538.9,
        "estimated_price_successful": 15181029692850460,
        "floor_price_failed": 196242014475498.84,
        "floor_price_successful": 15181029692846960
      },
      "missing": {
        "count_failed": 19305362,
        "count_successful": 0,
        "estimated_price_failed": 23400044509202650,
        "estimated_price_successful": 0,
        "floor_price_failed": 23400044508757584,
        "floor_price_successful": 0
      },
      "other": {
        "count_failed": 93331,
        "count_successful": 163360,
        "estimated_price_failed": 4953.56,
        "estimated_price_successful": 242217.6,
        "floor_price_failed": 4951.57,
        "floor_price_successful": 242172.86
      }
    }
@JeffLowe the calculations have been updated and appear to be as expected.

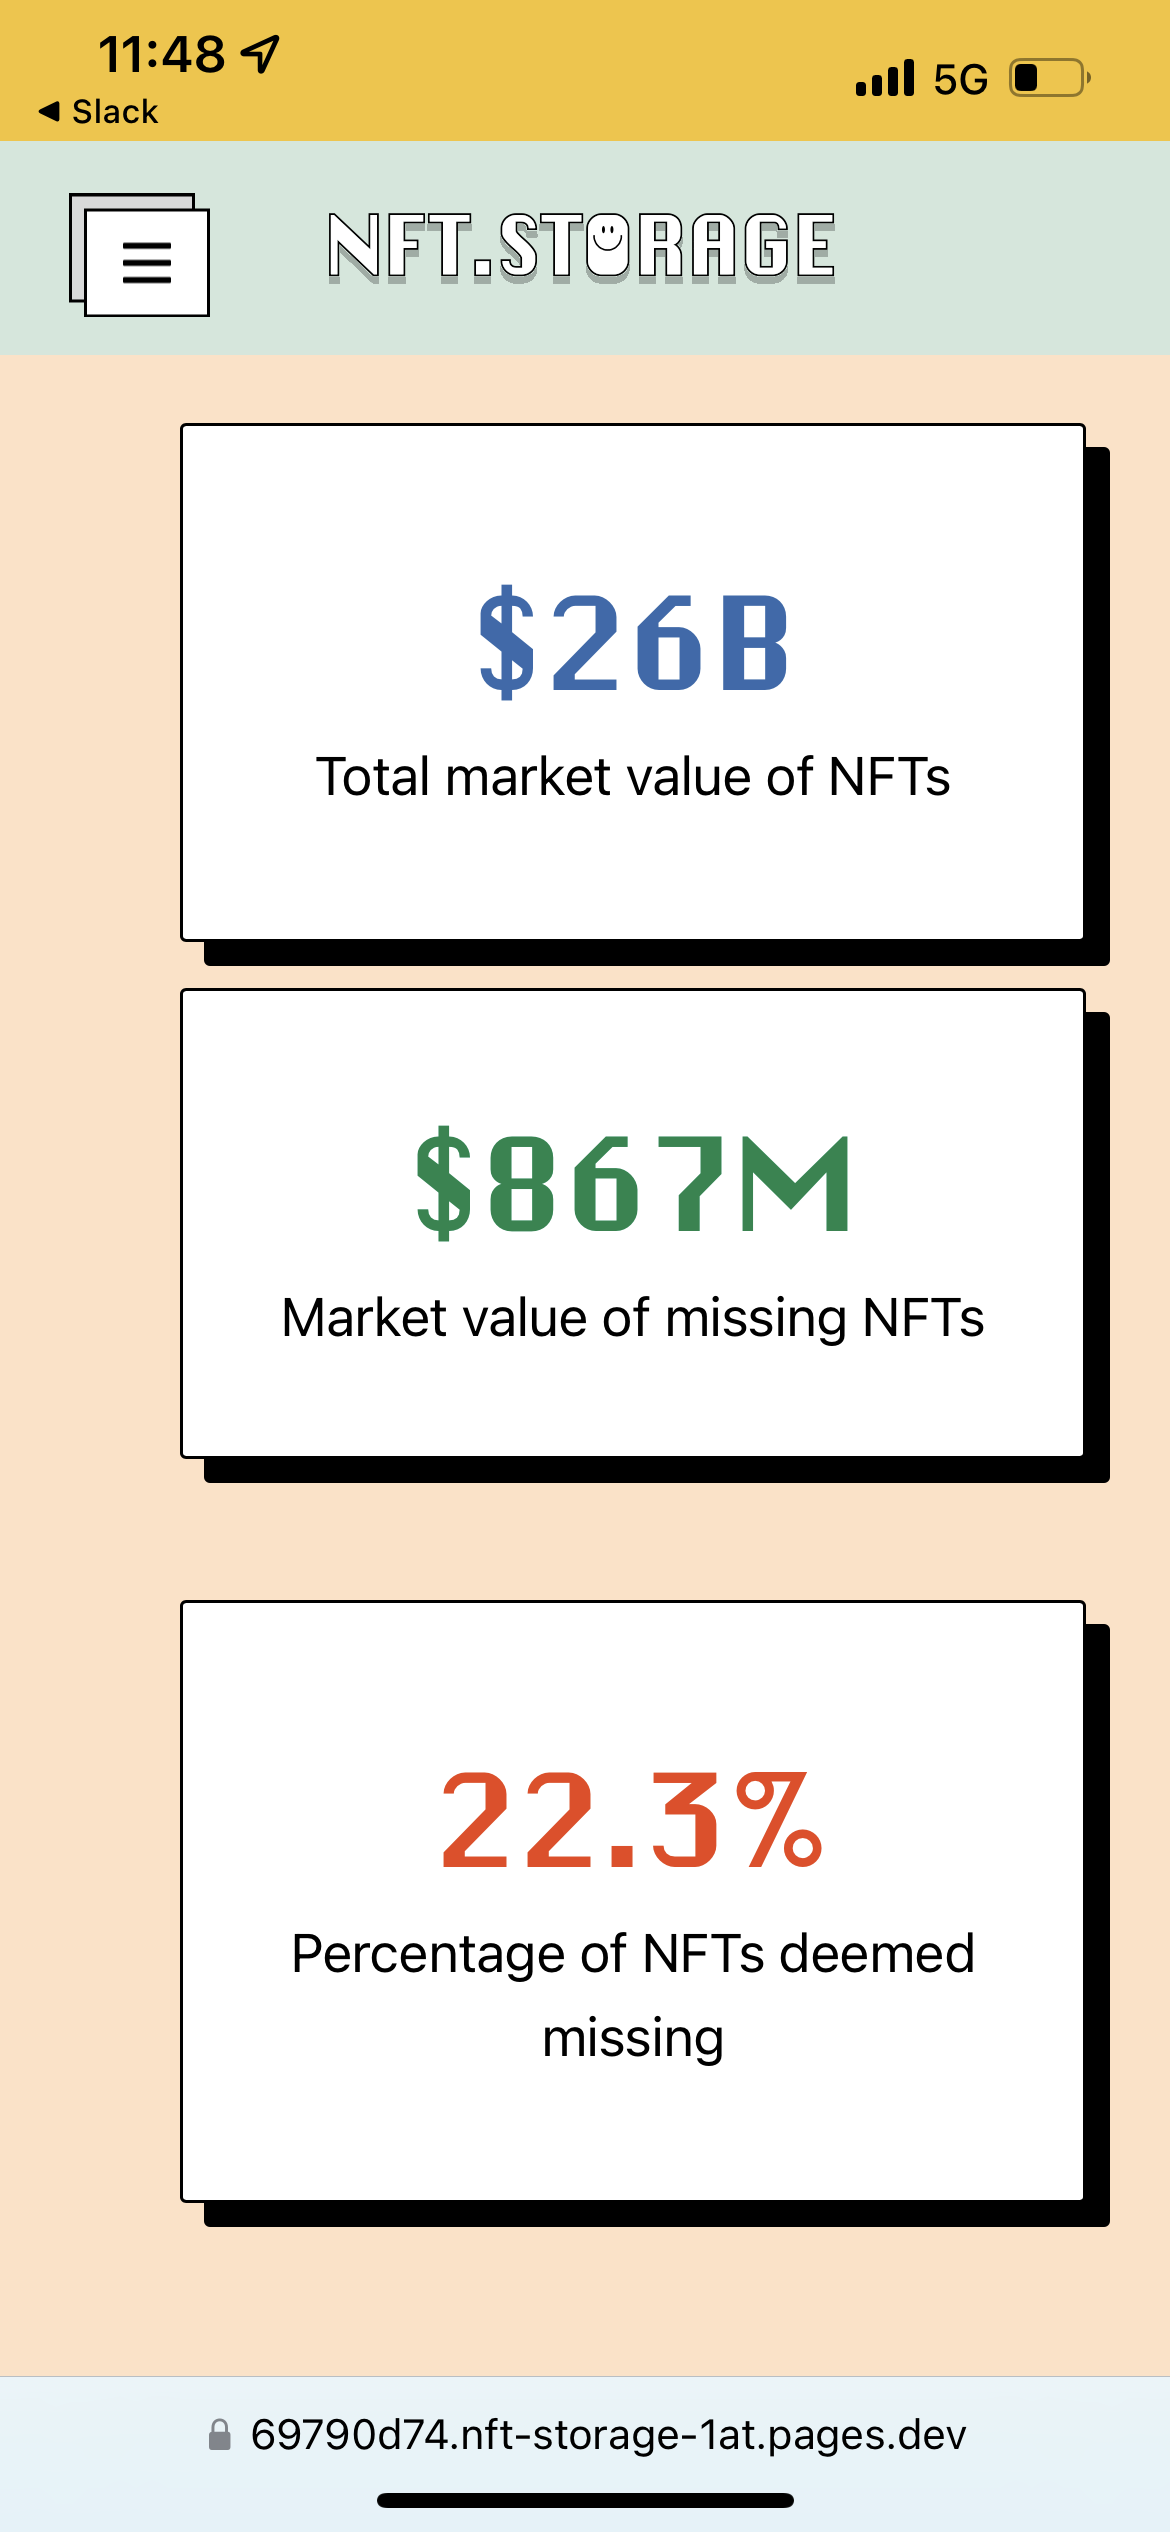
Can we make the percent green not red?

Can we change colors? Swap green and red coloration
@jchris, new updates have been pushed to this PR. A couple of comments on the latest updates:
I was able to confirm that the number 32 is "correct" for the Total uploads to NFT.Storage card. Correct as in that is what the staging API is returning for that data. The production API returns the correct result BTW. All that to say that the front-end is doing it's job as expected.
For the % of change, it looks like the UI is showing green for a rise and red for a drop in those particular stats. I added some clarity to that section by prepending drops with a minus sign (-0.03%) so that it is a bit more obvious. Let me know if that helps.