vscode
 vscode copied to clipboard
Extension host debug just shows loading indicator
Does this issue occur when all extensions are disabled?: Yes
- VS Code Version: 1.73.1
- OS Version: Ubuntu 22.10
Steps to Reproduce:
- Open a folder with VSCode
- Open VSCode's Process Explorer
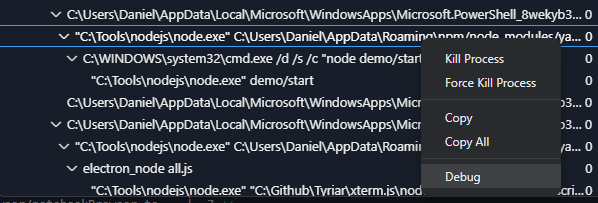
- Right click on
extensionHost, then click debug - Debug Panel opens and shows a loading indicator
- After some time, the loading indicator stops

Thanks for creating this issue! It looks like you may be using an old version of VS Code, the latest stable release is 1.74.0. Please try upgrading to the latest version and checking whether this issue remains.
Happy Coding!
I don't see this 'debug' option, and it seems a little suspicious to me, do you know about this @Tyriar?
@roblourens doesn't work for extension host for me, but it does for other node processes:
Useful code pointer: https://github.com/microsoft/vscode/blob/6e2ee35d1630b4bb916f35fdbd678848d129547c/src/vs/code/electron-sandbox/processExplorer/processExplorerMain.ts#L27-L28
Maybe to @connor4312?
Searching through the sources, I'm not sure what the extensionHost process is. I don't see a string with such casing in our source, and I don't reproduce this when running on Linux. Similar to Rob's screenshot I only see an extension-host which has no Debug option.
@Tyriar it sounds like you were able to hit this... what environment were you running in, and could you get the command line of whatever process ID is extensionHost for you?
This issue has been closed automatically because it needs more information and has not had recent activity. See also our issue reporting guidelines.
Happy Coding!
@SimonSiefke given you can still reproduce this, please run ps -p <pid> -o args, where pid is the PID in the right hand column of the extensionHost process. That should give us some hints on what it is/how it's getting spawned.
Sure, this is the output of ps -p 20761 -o args:
COMMAND
/snap/code/116/usr/share/code/code --ms-enable-electron-run-as-node --inspect-port=0 /snap/code/116/usr/share/code/resources/app/out/bootstrap-fork --type=extensionHost --skipWorkspaceStorageLock
ah, I was able to reproduce by using Remote SSH to connect to a Linux machine. But then debugging worked (well, I could connect, but as soon as the debugger pauses the ext host just deadlocks since the extension that handles debugging is the extension that's running in the process which is paused.)
@SimonSiefke did you install VS Code from snap, perchance?
Verification: there should no longer be a Debug option in the context menu if --inspect(-port|-brk)=0 is present in the command line (since we don't know what port to connect to)
This bug has been fixed in the latest release of VS Code Insiders!
@SimonSiefke, you can help us out by commenting /verified if things are now working as expected.
If things still don't seem right, please ensure you're on version 717d7d62c8b4566ab6704de931e7fe8e0649d810 of Insiders (today's or later - you can use Help: About in the command palette to check), and leave a comment letting us know what isn't working as expected.
Happy Coding!